Table of Contents
The photometer optics delivers diffraction-limited image quality (Strehl ratio >95%). Therefore PACS preserves the image quality provided by the Herschel telescope and is diffraction-limited on it whole energy range. The photometer PSF (see Figure 3.1) is dominated by the telescope and characterised by:
A narrow core which is round in the blue bands but slightly elongated in spacecraft Z direction in red.
A tri-lobe pattern seen at the several % level in all bands, most clearly in the blue with its strongest signal, and ascribed to imperfect mirror shape due to the secondary mirror tripod.
Knotty structure at sub-percent level, clearly seen in blue and indicated in green.
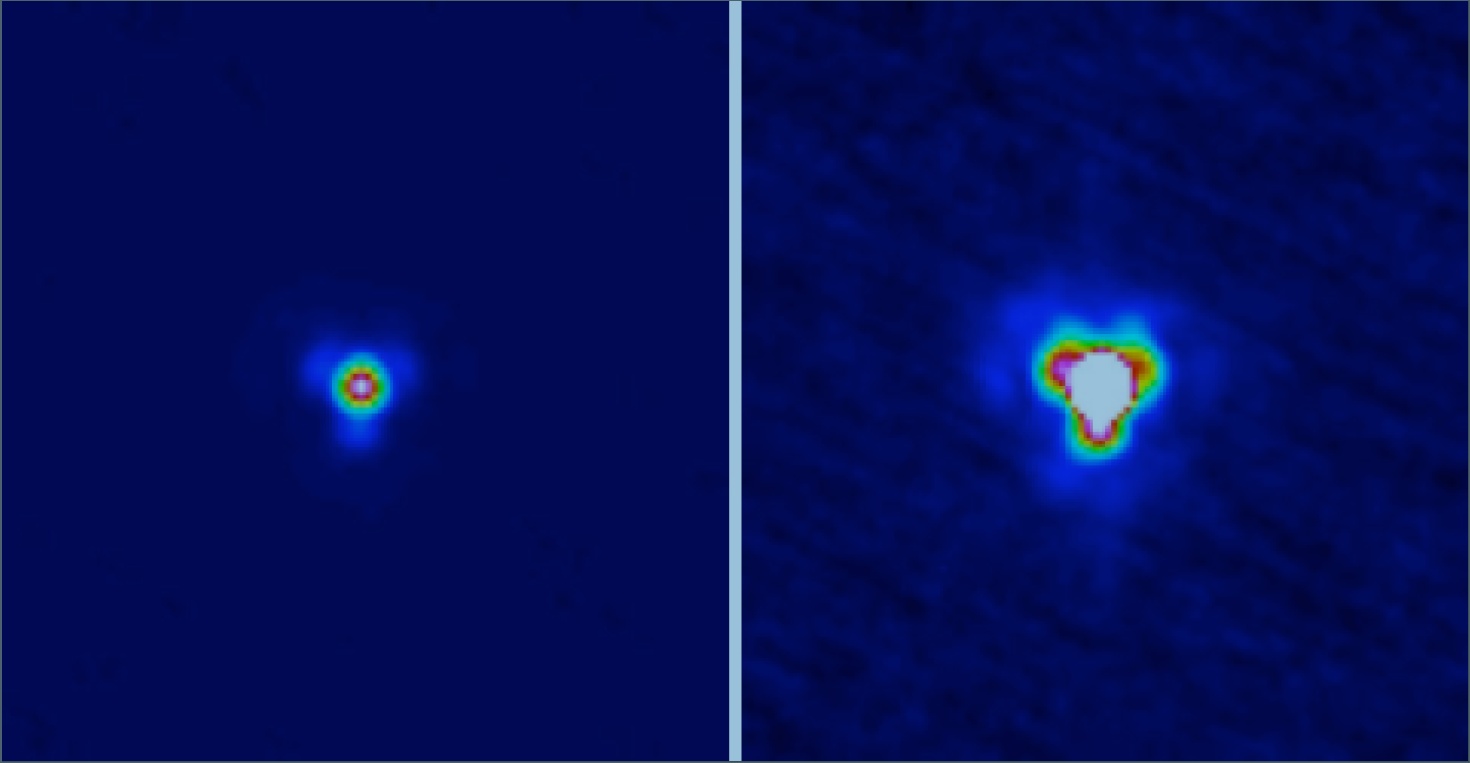
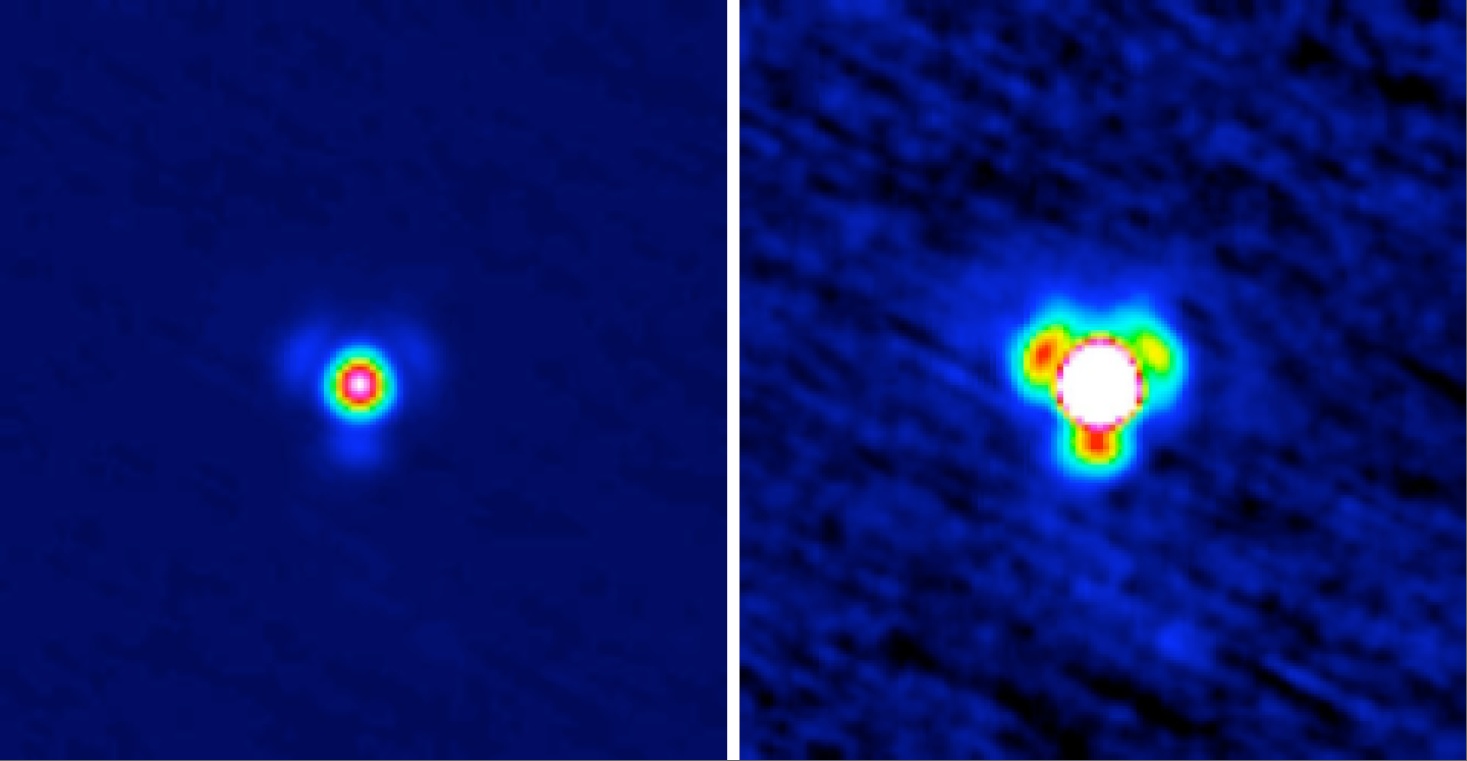
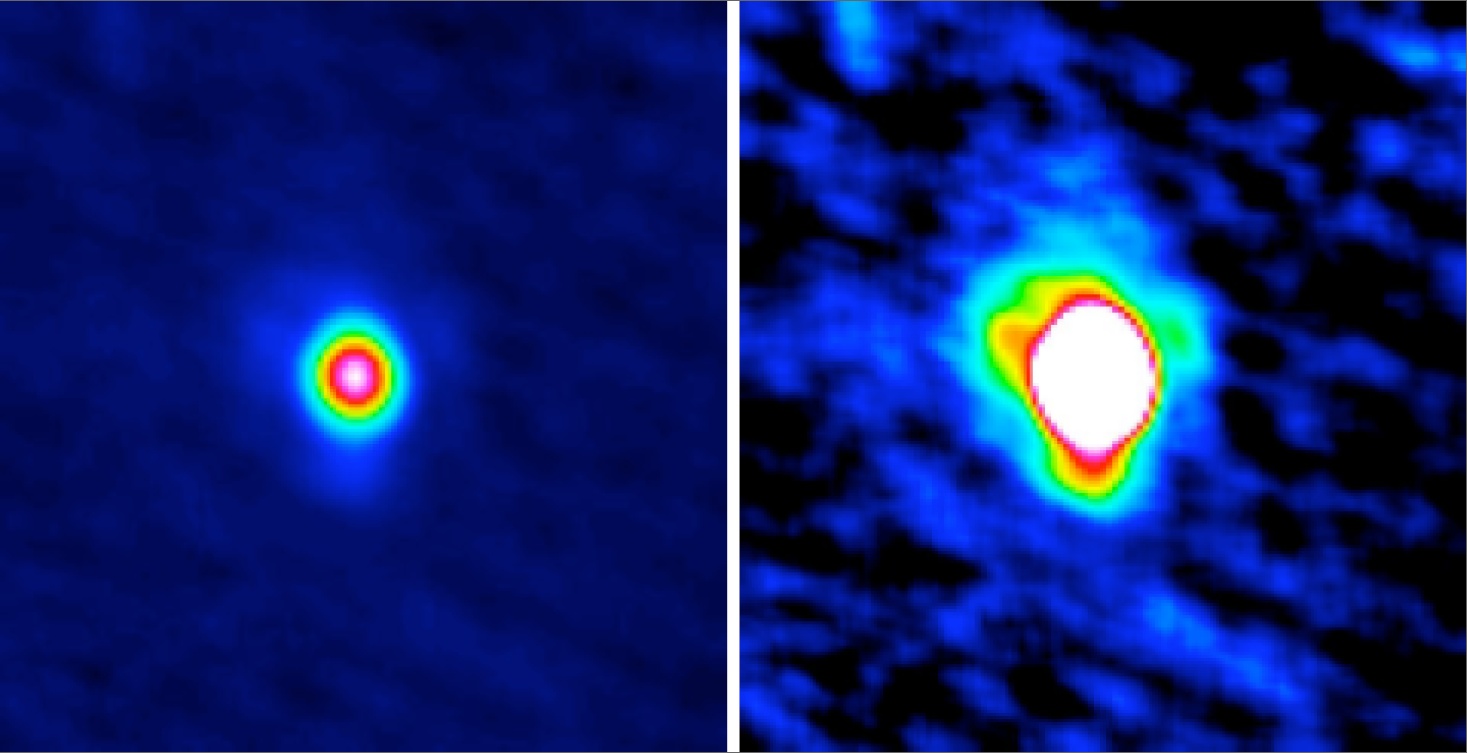
Figure 3.1. The photometer PSF in blue, green and red (top to bottom) derived from scans performed at 10 arcsec/s. Left-hand panels display the image with a linear scale up to the peak, while right-hand panels show up to 10% of the peak.
These PSFs and derived quantities reflect the intrinsic optical quality of Herschel+PACS. In a scanmap reduction they will be very slightly smeared, in particular at short wavelengths, because of the data averaging on-board (from 40Hz to 10Hz sampling), but also due to detector time constants telescope pointing jitter and drifts. For more detailed information on the PACS photometer PSF we refer to the PACS technical note PICC-ME-TN-033 (version 2.0, Apr. 04, 2012)
The photometer focal plane geometry, initially established on ground by scanning a back-illuminated hole mask across the bolometer arrays, has been adapted to the actual telescope by optical modeling. The in-flight verification required a small change in scale and a slight rotation to fit to the results of a 32x32 raster on the star αHer. In particular these measurements also show that the possibilities to further improve the calibration of detailed distortions are limited by short-term pointing drifts of the satellite. Residual measured inter-band offsets between blue/green (0.3 arcsec) and green/red (1.2 arcsec) have been characterised and are implemented in the astrometric processing chain. Current best point spread functions (PSF) have been determined on asteroid Vesta. The observed 3-lobe structure of the PSF (Figure 3.1) can be explained qualitatively by the secondary mirror support structure and has been verified in detail by ray tracing calculations taking the telescope design and known wave-front errors into account. The spatial resolution, expressed as encircled energy as a function of angular separation from PSF centre, is in reasonable agreement with expectations from telescope and instrument design.
Table 3.1. Results of fitting 2-dimensional gaussians to the PSF. Note these are fits to the full PSF including the lobes/wings. Position angles (east of North) are listed only for beams with clearly elongated core. The scan angle was 63 degrees for these observations.
Band | Speed (arcsec/s) | FWHM (arcsec) | PA (deg) |
|---|---|---|---|
Blue | 10 | 5.26 x 5.61 | |
20 | 5.46 x 5.76 | ||
60 | 5.75 x 9.0 | 62.0 | |
60 (parallel mode) | 5.86 x 12.16 | 63.0 | |
Green | 10 | 6.57 x 6.81 | |
20 | 6.69 x 6.89 | ||
60 | 6.89 x 9.74 | 62.3 | |
60 (parallel mode) | 6.98 x 12.7 | 63.0 | |
Red | 10 | 10.46 x 12.06 | 7.6 |
20 | 10.65 x 12.13 | 9.3 | |
60 | 11.31 x 13.32 | 40.9 | |
60 (parallel mode) | 11.64 x 15.65 | 53.4 |
Further details of the PACS PSF can be found in the technical note PICC-ME-TN-033 (version 2.0, Apr. 04, 2012). The aperture correction factors for the are listed in the table in section Figure 3.4.
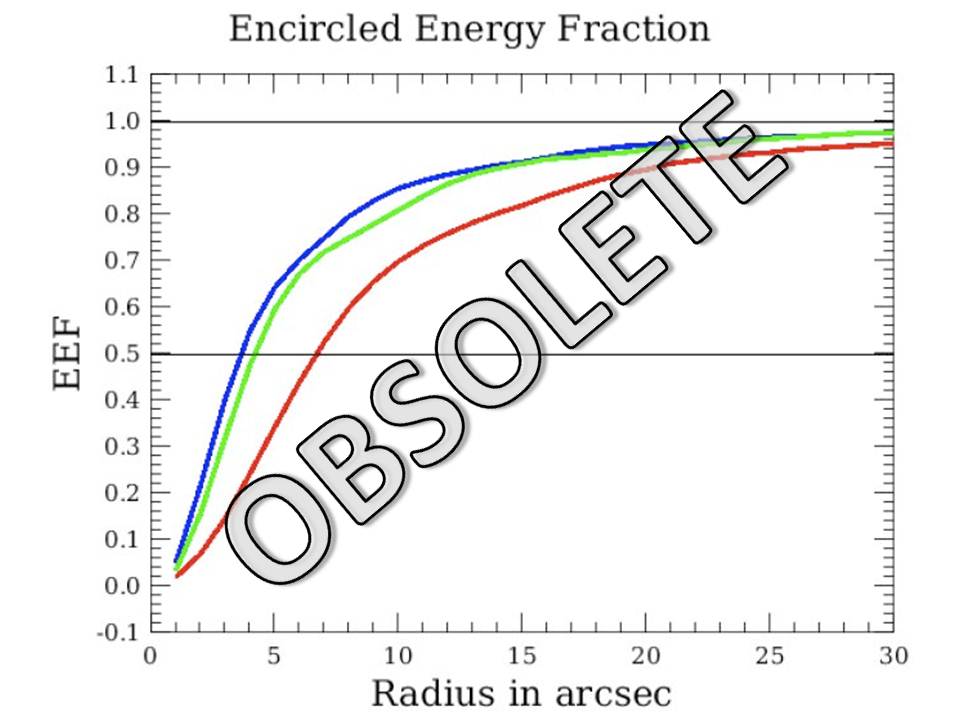
Figure 3.2. Encircled energy fraction as a function of circular aperture radius for the three bands. Derived from slow scan OD160 Vesta data.The EEF fraction shown is normalized to the signal in aperture radius 60arcsec, with background subtraction done in an annulus between radius 61 and 70 arcsec. This information is now known to be obsolete: the values tabulated in HIPE should be used instead.
![[Warning]](../../admonitions/warning.gif) | Warning |
|---|---|
| The Encircled Energy Fraction data given here have subsequently been made obsolete by later observations. The correct values are given in HIPE and only these should be used to derive the aperture correction until a full update of the figure and table here can be made. |
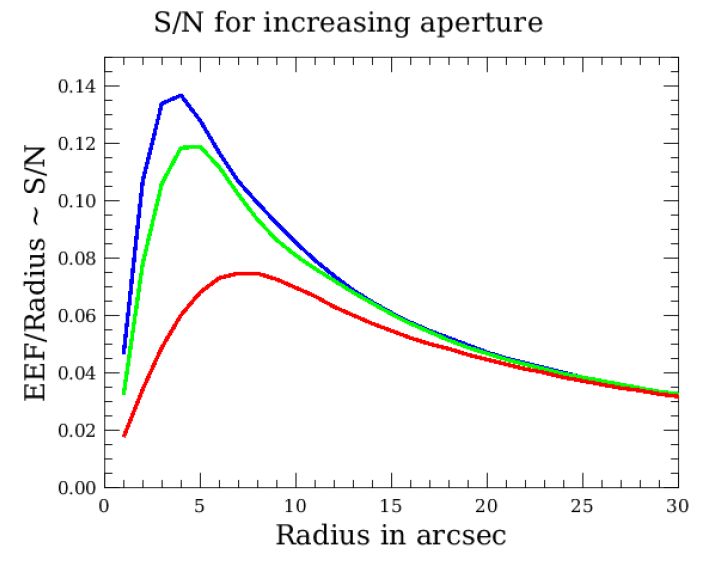
Figure 3.3. The signal-to-noise curve under the assumption that noise scales linearly with aperture radius. Note that this assumption is not met for scanmaps with 1/f noise.
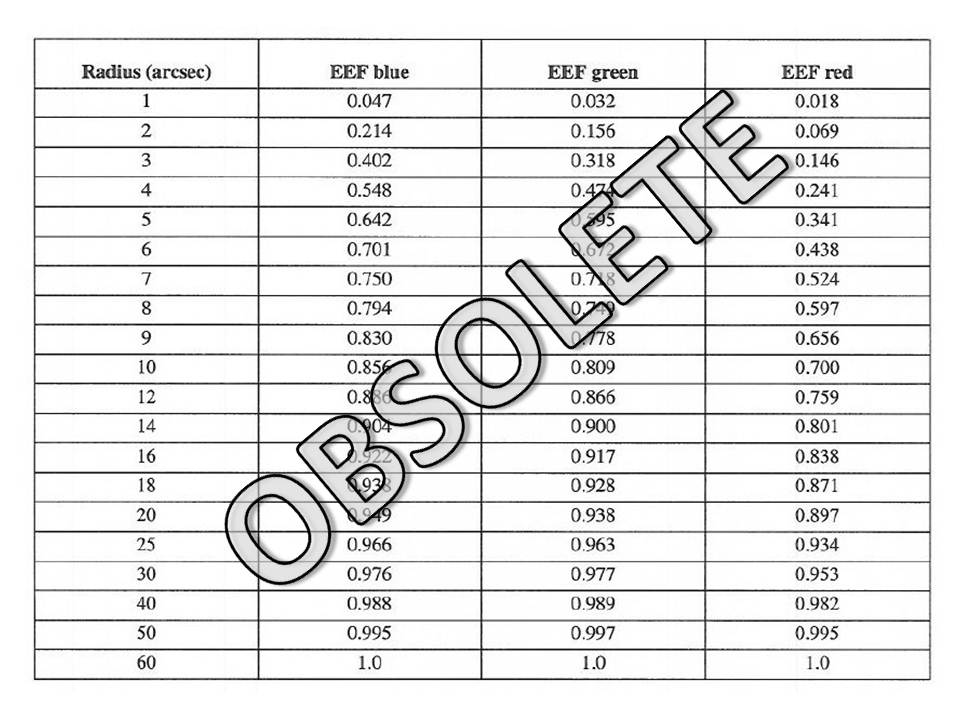
Figure 3.4. Encircled energy fraction as a function of circular aperture radius for the three bands. Derived from slow scan OD160 Vesta data in the three photometer bands. The EEF fraction shown is normalized to the signal in aperture radius 60 arcsec, with background subtraction done in an annulus between radius 61 and 70 arcsec. This information is now known to be obsolete: the values tabulated in HIPE should be used instead.