3.4. Characteristics of the photometer

3.4.1. Photometer spatial resolution

The photometer optics delivers diffraction-limited image quality (Strehl ratio >95%). Therefore PACS shall preserve the image quality provided by the Herschel telescope and is diffraction-limited on it whole energy range. The FWHM's in the three filter bands, together with main characteristics can be found in Table 3.1

Table 3.1. PACS photometer overall characteristics/performances

70µm

100µm

160µm

wavelength range (µm)

60-85

85-130

130-210

Resolution

~3

~2

pixel size (arcsec)

3.2

6.4

FOV (arcmin)

3.5 x 1.75

FWHM (arcsec)

5.2

7.7

12

Snapshot a QLA screen during FM ILT testing where an external blackbody is seen through a 4mn aperture, simulating a source, much more extended than a point source. Top: red array, bottom: blue array.

Figure 3.2.  Snapshot a QLA screen during FM ILT testing where an external blackbody is seen through a 4mn aperture, simulating a source, much more extended than a point source. Top: red array, bottom: blue array.

Simulation of point-source observation, showing the distribution of the flux as a function of position, taking into account the insensitive part of the focal plane. In this example the source is at the geometrical centre of the array - which is not a particularly smart choice. This a logarithmic display of the intensity falling on the detector (dynamic range display is 107), no noise or instrument physics, apart from the geometrical optical ones, is included. Note that with the source at the centre of the focal plane, only 18.6% of its flux falls on the sensitive parts of the detector.

Figure 3.3.  Simulation of point-source observation, showing the distribution of the flux as a function of position, taking into account the insensitive part of the focal plane. In this example the source is at the geometrical centre of the array - which is not a particularly smart choice. This a logarithmic display of the intensity falling on the detector (dynamic range display is 107), no noise or instrument physics, apart from the geometrical optical ones, is included. Note that with the source at the centre of the focal plane, only 18.6% of its flux falls on the sensitive parts of the detector.

3.4.2. Photometer filters

The transmission of the filter chain in each of the instrument channels has been calculated from measurements of the individual filters. All filters have been measured at room temperature; some filters or samples taken from the same filter sheet as used for the flight filter have also been measured in a contact gas cryostat near Helium temperature. Generally, filters show a small gain in transmission at cryogenic temperatures, but since not all of the actual filters could be measured we assume their ambient temperature performance as a good and somewhat conservative estimate. The filter transmission curves for the three photometer bands are plotted in Figure 3.4.

Filter transmissions of the PACS filter chains. The graph represents the overall transmission of the combined filters with the dichroic in each of the three bands of the photometer. The dashed vertical lines mark the nominal band edges.

Figure 3.4. Filter transmissions of the PACS filter chains. The graph represents the overall transmission of the combined filters with the dichroic in each of the three bands of the photometer. The dashed vertical lines mark the nominal band edges.

The reference wavelengths chosen for the 3 photometer filters are 70, 100 and 160 µm . These rounded values are close to the wavelengths that minimize the colour correction terms with the flight model filters.

3.4.3. Photometer bad pixels

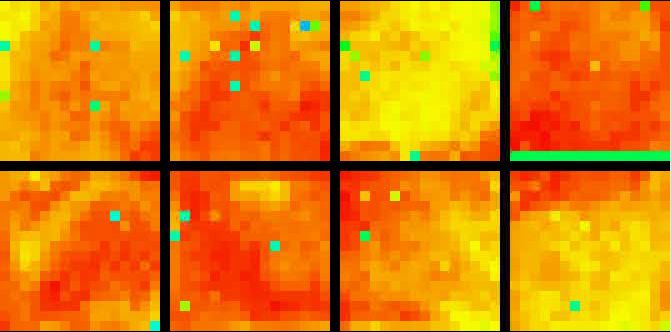
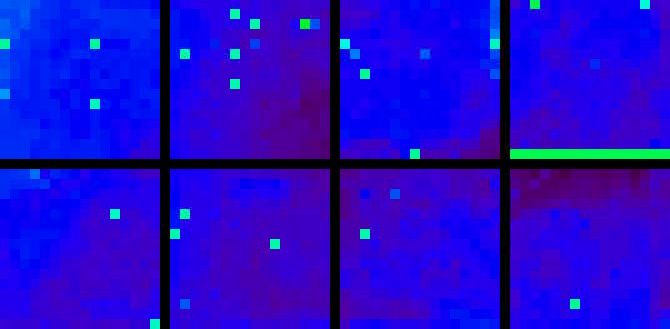
The flight model bolometer blue array displays about 2% of dead pixels (or very low responsivity pixels), including one row of 16 pixels, as can be seen on Figure 3.5 and Figure 3.6 in the upper right matrix.

FM blue array with low illumination

Figure 3.5. FM blue array with low illumination

FM blue array with high illumination

Figure 3.6. FM blue array with high illumination

3.4.4. Photometer sensitivity

The photometer sensitivity is driven by the foreground thermal noise emission, mostly from the telescope and the electrical noise of the readout electronics.

The estimated background noise from the telescope is about 1-2 × 10-16 WHz-1/2, depending on the bandpasses.

The post-detection bandwidth (thermal/electrical) of the bolometers is ~3 Hz; the noise of the bolometer/readout system has a strong 1/f component such that a clear 1/f “knee” frequency cannot be defined. a factor of ten in post-detection frequency (i.e., 0.3 Hz – 3 Hz) is assumed to be sufficient to cover both, chopped and continuously scanned observations, and the noise in this band is considered as relevant for sensitivity estimates. The “quantum efficiency”, i.e., the fraction of the power incident on a pixel that gets actually absorbed by the pixel, has been modeled for the PACS absorber structure, and averages 80%.

There are two modes of reading the bolometers arrays, a so called Direct Mode (DM) and the Double Differential Correlated Sampling (DDCS) mode where an internal electrical reference is subtracted to the signal of the bolometer signal in order to get rid of external electromagnetic perturbations. The DM mode shows less noise than the DDCS, by up to a factor 2 in the blue channel, and has been selected as the default mode, pending further confirmation in ground tests that electromagnetic perturbations from the spacecraft wiring will stay at a low enough level to allow operations in this mode. In DM mode the latest NEP measurements from FM ILT tests early 2007 are 2.5 x 10⁻¹⁶ WHz-1/2 in the blue channel and 4 x 10-16 WHz-1/2 in the red channel.

Including all components in the detection path as described in the previous sections, these NEPs translate into the photometer sensitivities tabulated in Table 3.2, as implemented in HSpot.

[Note]Note
If the DDCS mode has to be used in-orbit the sensitivities could be twice worse in the blue band and 25% worse in the red channel.

Table 3.2. PACS photometer predicted sensitivity 5σ-1 hour in mJy

central wavelength

70µm

100µm

160µm

off-array chopping

3.75

4.1

5.75

on-array chopping

2.7

2.8

4.1

scan mapping

2.25

2.4

3.4

The on-array chopping technique is only used in point-source photometry mode, while the small-source photometry mode and large raster mode make use of off-array chopping. The scan map mode as a slightly better sensitivity than the point-source photometry mode, because the chopper in not involved, the signal is modulated by the line scanning. See chapter 4 for more information on the observing modes.

To a first order the sensitivity in all mode scales with the inverse of the square root of the on-source observation time. This scaling is used for the sensitivities and S/N ratios reported by HSpot.