The transmission of the filter chain in each of the instrument channels has been calculated from measurements of the individual filters. All filters have been measured at room temperature; some filters or samples taken from the same filter sheet as used for the flight filter have also been measured in a contact gas cryostat near Helium temperature. Generally, filters show a small gain in transmission at cryogenic temperatures, but since not all of the actual filters could be measured we assume their ambient temperature performance as a good and somewhat conservative estimate. The filter transmission curves for the three photometer bands are plotted in Figure 3.5. The photometer transmission curves are available in HCSS as PCalPhotometer_FilterTransmission_FM_v1.fits and the bolometer response in the PCalPhotometer_Absorption_FM_v2.fits.
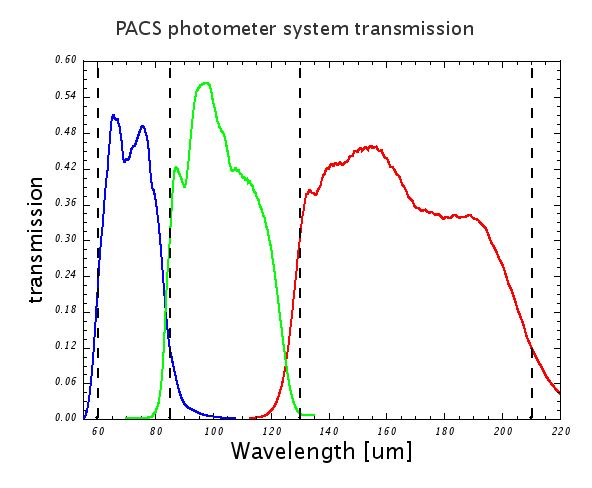
Figure 3.5. Filter transmissions of the PACS filter chains. The graph represents the overall transmission of the combined filters with the dichroic and the detector relative response in each of the three bands of the photometer. The dashed vertical lines mark the original intended (design values) of the band edges.
The reference wavelengths chosen for the 3 photometer filters are 70, 100 and 160 µm . These rounded values are close to the wavelengths that minimize the colour correction terms with the flight model filters.
No indications of any near- or mid-infrared filter leakage could be identified. Required colour-corrections for the photometric PACS reference wavelengths (70, 100, 160 µm) which have been determined from the photometer filter trasnmission curves and bolometer responses (See Figure 3.5) are quite small. Suitable corrections factors for a wide sample of SED shapes can be found in Poglitsch et al. (2010).