The power emitted or absorbed by a single spectral line in the far-infrared is normally several orders of magnitudes lower than the power in the dust continuum over a typical photometric band. Sensitivity is thus the most important parameter for optimisation; with background-limited detector performance the best sensitivity is obtained if the spectrometer satisfies the following conditions: the detection bandwidth should not be greater than the resolution bandwidth, which in turn should be matched to the line width of the source, and, the line flux from the source must be detected with the highest possible efficiency in terms of system transmission, spatial and spectral multiplexing. Subtraction of the high telescope background has to be achieved by appropriate spatial and/or spectral modulation techniques.
The integral-field spectrometer covers the wavelength range from 51µm to 220µm, in two channels that operate simultaneously in the blue (51-105µm) and red (102-220µm) band. It provides a resolving power between 1000 and 4000 (i.e. a spectral resolution of ~75-300km/s) depending on wavelength, for a fixed grating position the instantaneous coverage is ~1500km/s. It allows simultaneous imaging of a 47"x47" field of view, resolved into 5x5 pixels. An image slicer employing reflective optics is used to re-arrange the 2 dimensional field-of-view along a 1x25 pixels entrance slit for the grating, as schematically shown in Figure 2.6.
This integral-field concept with spectral and spatial multiplexing allows for the most efficient detection of weak individual spectral lines with sufficient baseline coverage and high tolerance to pointing errors without compromising spatial resolution, as well as for spectral mapping of extended sources regardless of their intrinsic velocity structure.
The grating is Littrow-mounted, i.e. the entrance and exit optical paths coincide. It is operated in first, second or third order, respectively, to cover the full wavelength range. The first order covers the range 102-210µm, the second order 71-105µm, and the third order 51-73µm. Anamorphic collimating optics expands the beam to an elliptical cross section to illuminate the grating over a length required to reach the desired spectral resolution. The grating is actuated by a cryogenic motor with arcsec precision which allows spectral scanning/stepping for improved spectral flat-fielding and for coverage of extended wavelength ranges. The settling time for typical motions used in the PACS-AOTs is sufficiently short to allow for grating scans at various sampling densities.
The light from the first diffraction order is then separated from the light of the two other orders by a dichroic beamsplitter and passed into two optical trains feeding the respective detector arrays (stressed/unstressed) for the wavelength ranges 102-220µm and 51-105µm. Anamorphic re-imaging optics is employed to independently match the spatial and spectral resolution of the system to the square pixels of the detector arrays. The filter wheel in the short-wavelength path selects the second or third grating order.
It is possible to operate both spectrometer detector arrays simultaneously. For wide scans, full spectra can so be obtained in both selected grating orders. In a spectral line mode in the grating order-of-interest, the other array yields narrow-band continuum data, or in suitably line-rich sources, serendipitous lines.
The image slicer's main function is to transform the 5x5 pixel image at its focal plane into a linear 1x25 pixel entrance slit for the grating spectrometer. The slicer assembly consists of 3 set of mirrors:
The slicer stack: 5 identical spherical field mirrors, individually tilted, which forms separate pupil images for each "slice" on the set of 5 capture mirrors.
The capture mirrors re-combine the separate beams into the desired linear image on the set of 5 spherical mirrors at the exit of the slicer assembly.
The field mirrors at the exit re-combine the pupils separated in the slicer into a common virtual pupil. The collimators of the spectrometer will later form an (anamorphic) image of this virtual pupil onto the grating. At the same time, the field mirror apertures serve as the entrance slit of the grating spectrometer.
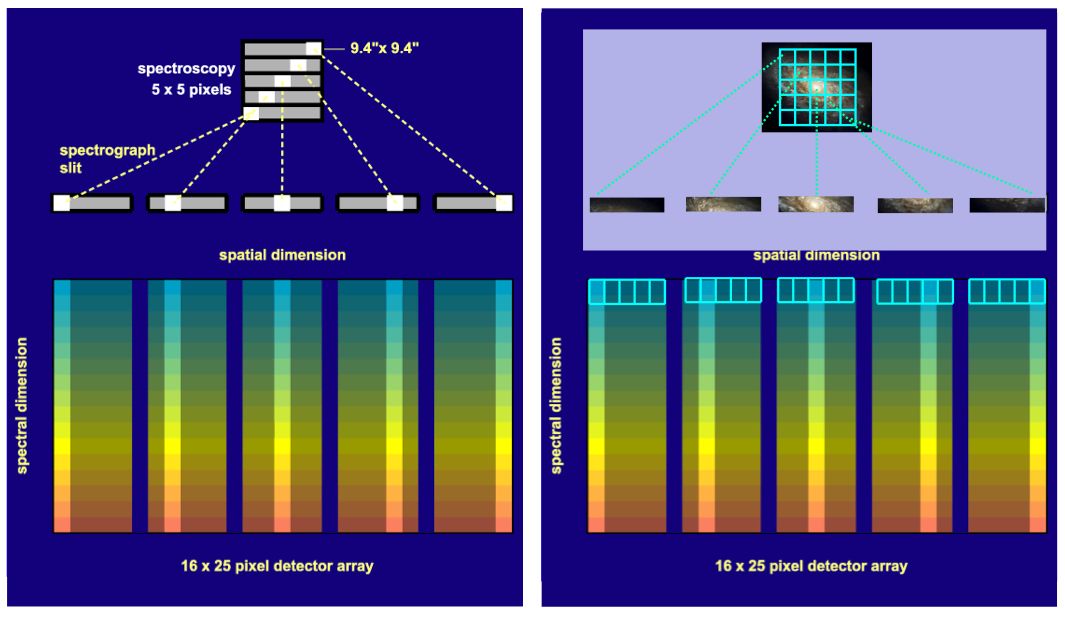
Figure 2.6. Integral-field spectrometer concept : projection of the focal plane onto the detector arrays in spectroscopy mode. The image slicer re-arranges the 2D field along the entrance slit of the grating spectrograph such that, for all spatial elements in the field, spectra are observed simultaneously. Note, the blank space left between the slices to reduce crosstalk between left- and rightmost pixels of adjacent slices (see also Figure 2.9 ). On the righ-hand side the spatial slicing scheme is illustrated by the image of an extended structure.
The grating assembly consists of a Littrow-mounted grating, a mounting bracket that interfaces with the FPU structure, the actuator with redundant coils that provides positioning of the grating, the redundant position sensors, a launch lock mechanism with redundant coils for the launch lock actuator, the redundant temperature sensors and the duplicated cryo-harness (see Figure 2.7 ).
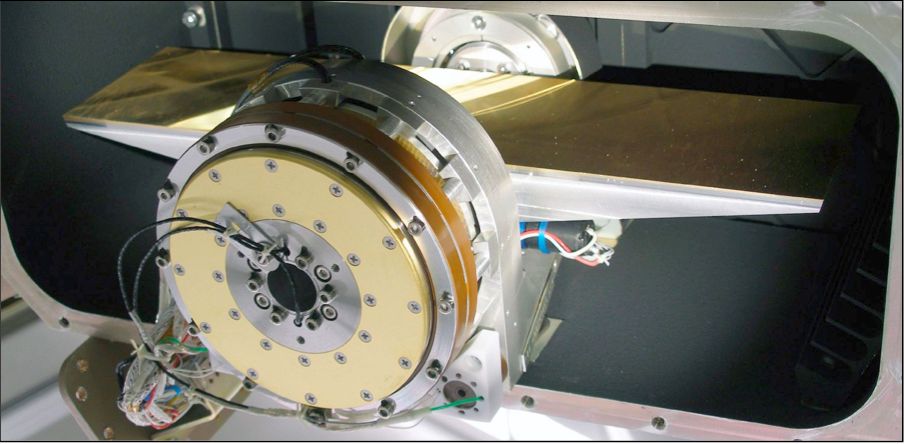
Figure 2.7. Flight model grating unit. A torquer motor is used to actuate the grating angle which is measured with sub-arcsecond precision by an inductosyn angular resolver.
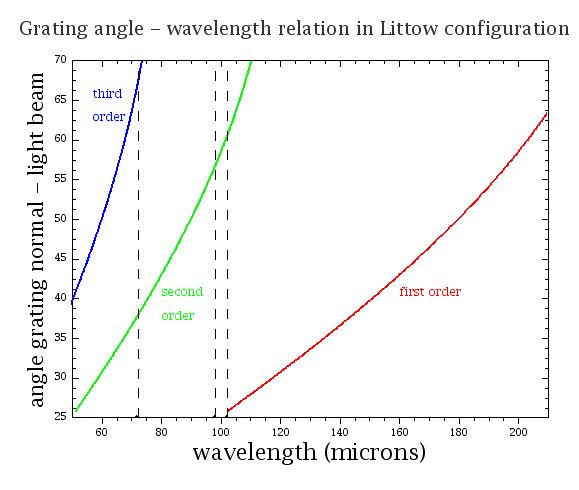
The grating blank has a length of 320mm with a groove period of 8.5 ±0.05 grooves/mm, with a total of approximatively 2720 grooves. The reflection grating is operated in the first (102-210 µm), the second (72-102 µm) and the third diffraction order (51-72 µm). Grating deflections from 25 degrees to 70 degrees are possible to cover the full wavelength range of each order. A graphical correlation of the grating angle of incidence versus order and wavelength is given in Figure 2.8.
The PACS order sorting filters enable the spectral purity of the selected band by suppressing contributions by other orders the detector is sensitive to. There are in total 3 bands in the PACS spectrometer: 55-72 µm, 72-102 µm and 102-210 µm. The filter transmission is shown in Figure 4.3. The filter train of both the photometer and spectrometer channels is illustrated in Figure 2.4.
The spectrometer employs two Ge:Ga photoconductors arrays (low and high stressed) with 16x25 pixels on which the 16 spectral elements of the 25 spatial pixels are imaged.
The Ge:Ga photoconductor arrays have a modular design: they are made of 25 linear modules of 16 pixels each are stacked together to form a 2-dimensional array. Ge:Ga photoconductors are sensitive in the wavelength range 40-110/120 µm without any stress. A stress is therefore applied to improve the long wavelength sensitivity. The stressing mechanisms ensures homogeneous stress on each pixel along the entire pile of 16 spectral elements. The low-stressed blue detectors has a mechanical stress on the pixels which is reduced to about 10% of the level needed for the long-wavelength response of the red detectors.
Light cones in front of the actual detector block provide an area-filling light collection in the focal plane and feed the light into the individual integrating cavities around each individual, mechanically stressed detector crystal. The light cones also act as a very efficient means of straylight suppression because their solid angle acceptance is matched to the re-imaging optics such that out-of-beam light is rejected.
Responsivity measurements of both stressed and unstressed modules show sufficiently homogeneous spectral and photometric response within each module and between modules. Absolute responsivity calibration for optimum bias under in-orbit conditions is under way and will most likely give numbers of ~10 A/W for the unstressed detectors and ~40 A/W for the stressed detectors. The detectors are operated at (stressed) or slightly above (unstressed) the “Level 0” cryostat temperature (~1.65 K). Each linear module of 16 detectors is read out by a cryogenic amplifier/multiplexer circuit (CRE) in CMOS technology. The readout electronics is integrated into the detector modules, but operates at “Level 1” temperature (3...5 K). Measurements of the NEP of both arrays after integration into the instrument flight model at characteristic wavelengths and with representative flux levels have confirmed the performance measured at module level. Only a small fraction of pixels suffers from excess noise. Median NEP values are 8.9 × 10⁻¹⁸WHz-1/2 for the stressed and 2.1 × 10⁻¹⁷WHz-1/2 for the unstressed detectors, respectively. The achievable in-orbit performance was expected to depend critically on the effects of cosmic rays on the detector response. Proton irradiation tests performed at the synchrotron source of the Universite Catholique de Louvain (Louvain la Neuve, Belgium) complemented by a γ-ray radiation test programme at MPIA indicated that NEPs close to those measured without irradiation should actually be achievable in flight. In-flight measurements performed during the commissioning phase of Hershel confirmed these findings.
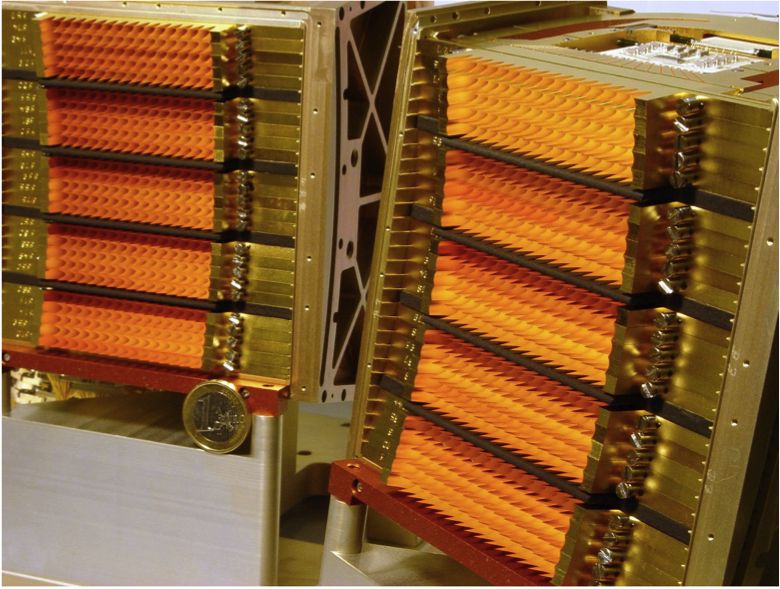
Figure 2.9. Array close-ups: The 25 stressed and low-stress modules (corresponding to 25 spatial pixels) in the red- and blue arrays are integrated into their housing. Stress is applied to the whole stack of 16 Ge crystals, providing the instantaneous spectral coverage for each of the 25 spatial fields on the sky. Light cones provide for area-filling collection onto the individual detectors.
Each module is attached to an 18 channel cold readout electronics (CRE) amplifier/multiplexer circuit in CMOS technology. The photocurrent from the detector crystals is integrated on a capacitor. The capacitance is switchable between 4 values from 0.14 to 1.15pF to provide sufficient dynamic range for the expected flux range. The integration process is reset after preset interval. During the integration the voltage signal is regularly read in a non-destructive way with a frequency of 1/256s leading to an integration ramp with 256 / (reset interval) samples.
The extensive PV program aimed at optimising the AOT parameters led to ramps of 32 samples, i.e. 1/8 second, for all all spectrometer AOTs. The scientific signal corresponds to the slope of these integrating ramps, and, for bandwith reasons, these are fitted on-board. Hence, a spectrometer observation of n seconds always results in 18 x 25 x 8n samples for each camera, i.e. red and blue: 18 spectral pixels for each of the 25 spaxels, each providing 8 measures per second.
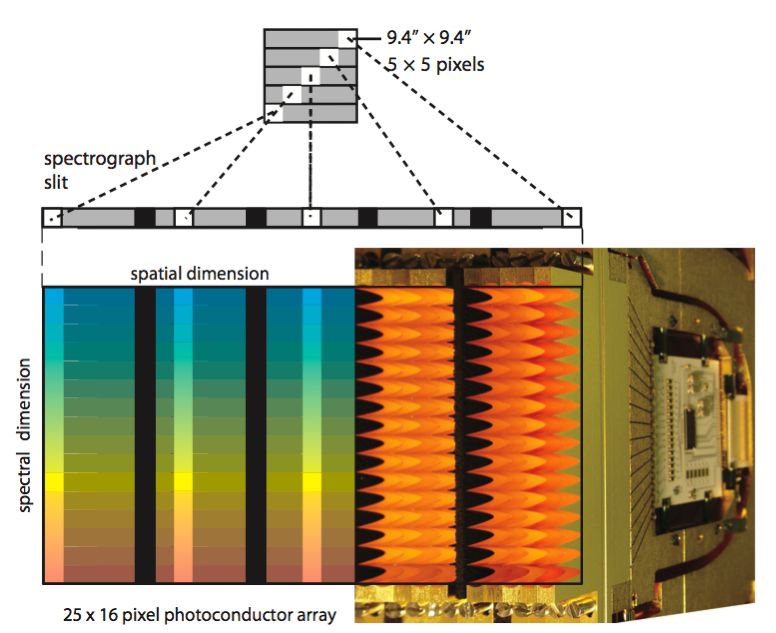
Figure 2.10. The optical image slicer re-arranges the 2-dimensional field along the entrance slit of the grating spectrograph such that for each spatial element in the field of view, a spectrum can be simultaneously observed with a 2D detector array. On the right, part of the red photoconductor array with its area-filling light-cones and CREs are shown scaled to the schematic picture of the 25 by 16 array.