4.3. Spectrometer filters

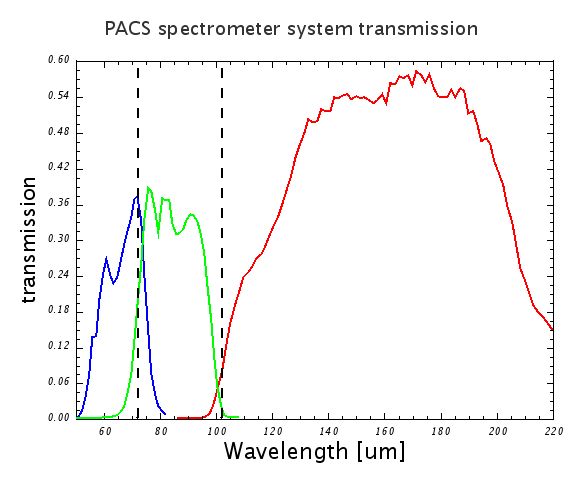
The transmission of the filter chain in each of the instrument channels has been calculated from measurements of the individual filters (see Photometer filters section). The filter transmission curves for the three grating orders are plotted in Figure 4.3.

Transmissions of the spectrometer filter chains. The graph represents the overall transmission of the combined filters in each of the three grating orders of the spectrometer. The vertical lines mark the edges between spectral bands.

Figure 4.3. Transmissions of the spectrometer filter chains. The graph represents the overall transmission of the combined filters in each of the three grating orders of the spectrometer. The vertical lines mark the edges between spectral bands.