The fraction of the Herschel+PACS PSF seen in one spaxel varies with wavelength. In order to recover full beam line fluxes or flux densities for point sources, a wavelength dependent correction factor needs to be applied to the line fluxes or flux densities as measured in the central spaxel only (see Section 4.4). The wavelength dependent fraction between the point source flux seen in the central spaxel and the full beam flux has been modelled and scaled to actual measurements of the PACS spectrometer PSF maps measured on Neptune. The correction curve is depicted in Figure 4.5. This correction curve assumes a point source perfectly centred on the central spaxel. This curve is applied in the interactive pipeline scripts provided for point-source data reduction, and can be found in the calibration table calTree.spectrometer.pointSourceLoss.
Alternatively, the full flux or flux density of a source can be recovered by co-adding the spectra obtained from several spaxels ("aperture photometry"). In this case, of course, no correction factor needs to be applied. However, if accurate line shapes are to be preserved, at the level of the instrumental resolution or below, it is not recommended to co-add the spectra obtained in different spaxels. As with all slit spectrographs, a different position of the source photocenter in the dispersion direction of the slit induces wavelength shifts and line profile skews (Section 4.7.3). Co-adding line profiles in different spaxels will therefore result in broadened and skewed line shapes. Work on proper optimal extraction and fitting of spectral lines is under way in the PACS ICC.
The PACS spectrometer flux calibration accuracy is limited by detector response drifts and slight pointing offsets. These limit both the absolute flux accuracy and relative accuracy within a band. Corrections for both effects are under study by the PACS ICC and will be provided to the user in forthcoming HIPE software versions. Awaiting these corrections, the following accuracies shall be assumed when interpreting PACS spectroscopy data.
This accuracy applies for single line fluxes or continuum flux densities at a given wavelength in any spaxel. Beware of the correction needed for flux falling out of the pixel for point sources. The absolute flux calibration accuracy was determined from observations of ~30 absolute flux sky calibration sources (fiducial stars, asteroids, planets) of which some are shown on Figure 4.25, Figure 4.26, Figure 4.27 and Figure 4.28. These figures show the observed flux of calibrators at key wavelength in the four spectral bands divided by model predictions. The Table 4.3 shows a summary of results, the RMS of (PACS observation / predicted model flux) and peak-to-peak scatter around the expected flux densities. This is the absolute flux calibration accuracy to assume for a single PACS spectroscopy observation.

Figure 4.25. Average observed PACS spectrum of sky flux calibrators, corrected with the response derived from the calibration block, divided by model predictions - band B2A.
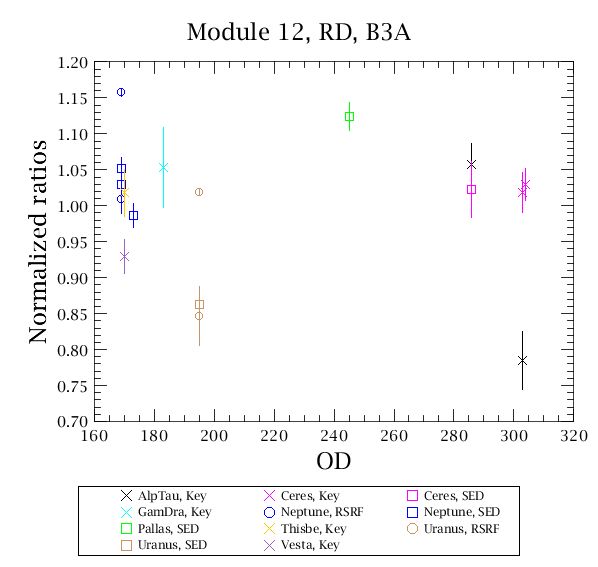
Figure 4.26. Average observed PACS spectrum of sky flux calibrators, corrected with the response derived from the calibration block, divided by model predictions - band B3A.
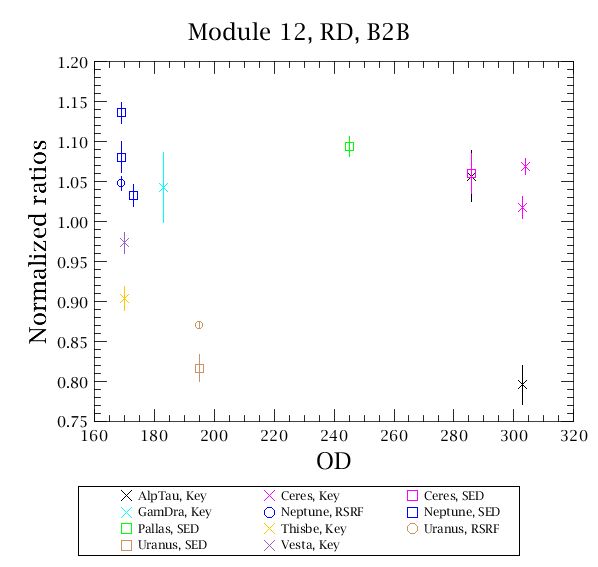
Figure 4.27. Average observed PACS spectrum of sky flux calibrators, corrected with the response derived from the calibration block, divided by model predictions - band B2B.
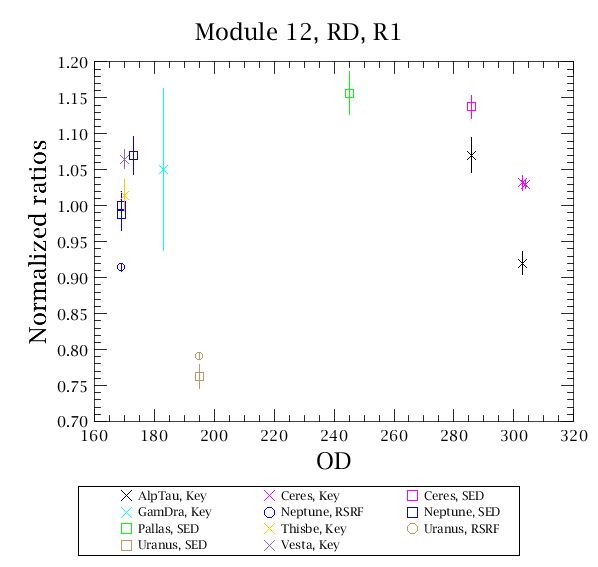
Figure 4.28. Average observed PACS spectrum of sky flux calibrators, corrected with the response derived from the calibration block, divided by model predictions - band R1.
Broad spectral features (a few micrometer) and continuum shape difference can be introduced by transient effects and pointing offsets. Corrections for these effects are under study. In the mean time, such features should not be interpreted blindly. Note that due to the origin of these effect, they will be seen differently in every observation, so dividing two PACS spectra will not eliminate these instrumental effects. The Table 4.4 summarises the resulting accuracy to assume when comparing relative line fluxes within a spectral band. When comparing line fluxes across spectral bands, the absolute flux accuracies in Section 4.10.2.1 apply. This is also the current limit on detection of broad spectral features (solid state features, dust continuum shape). These numbers apply to the wavelength regions not affected by spectral leakage (see Section 4.8).
The currently available PACS spectroscopy pipeline uses a fixed nominal response value for every pixel are based on flux calibration standard measurements of sources placed on the central spaxel. The absolute calibration of the surrounding spaxels is tied to the central spaxel via a flatfield determined on the telescope background. These flatfields reproduce very well. When we divide the 'master flatfield' by the individual flatfields measured, we see a standard deviation of 2-3%. The Table 4.5 gives the relative accuracy (peak-peak) when comparing line or continuum fluxes in different spaxels. The main uncertainty in interpreting line flux differences in different spaxels is the knowledge about the source structure and the beam probed by the different spaxels.
The absolute flux calibration of the PACS spectrometer is based on observations of flux calibration standards using chopped spectroscopy modes. There are hints of systematic differences in the response scaling between chopped and unchopped mode due to response transients within the chopping pattern. These are well within the flux calibration uncertainties listed in Section 4.10.2.1. Background subtraction for unchopped spectroscopy measurements is done by subtracting the telescope background spectrum measured at an off-position. Repeated off-position background spectrum measurements show a ~4% peak-to-peak reproducibility in total absolute flux (telescope + source) and a ~1% in-band shape error for the longest scans we have observed so far. In observations of low continuum sources this will dominate the continuum flux accuracy. For a 20 Jy source, having a ~200 Jy telescope background these uncertainties translate to ~40% continuum uncertainty and ~10% in-band continuum shape error.