A second pass in the optics of the PACS spectrometer can cause a ghost image on some spaxels. Figure 4.23 shows the spaxels where a second pass ghost might appear, and the location of the corresponding spaxels where the originating, real emission is located. The ghost appears shifted in wavelength. If a source in one of the originating spaxels shows a strong spectral line, typically an atomic fine structure line, a weak, broadened line can be seen at an offset wavelength in the corresponding spaxel affected by 2nd pass ghosts. The peak flux of this line is typically ~5% of the line peak of the originating line. The integrated line flux can be up to ~14% of the integrated line flux of the originating line. An example is shown in Figure 4.24. The wavelength offset between the originating line and the ghost line depends on the spectral order of the band, and varies with wavelength. A few examples for the strongest fine structure lines in the PACS wavelength range are given in Table 4.2. A more comprehensive list of frequently observed lines is provided in the PACS Spectrometer Calibration Document Appendix B.
Before interpreting broad spectral lines in spaxels potentially affected by the 2nd pass ghosts, observers should use these tables and, if available, the spectra observed in the corresponding ghost source spaxel, for the presence of a strong line at the originating wavelength. Point source observations, well centered on the central spaxel, are not affected. The central spaxel of the IFU is not contaminated by 2nd pass ghosts.
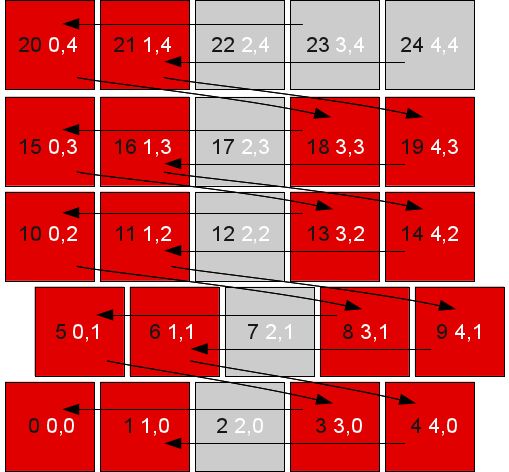
Figure 4.23. Location of the spaxels where a second pass ghost might appear. In black are the module numbers (this is the numbering in the PACS frames product), in white the row and column numbers in the PACS cube products. The arrows indicate the spaxel where the originating, real emission is located.
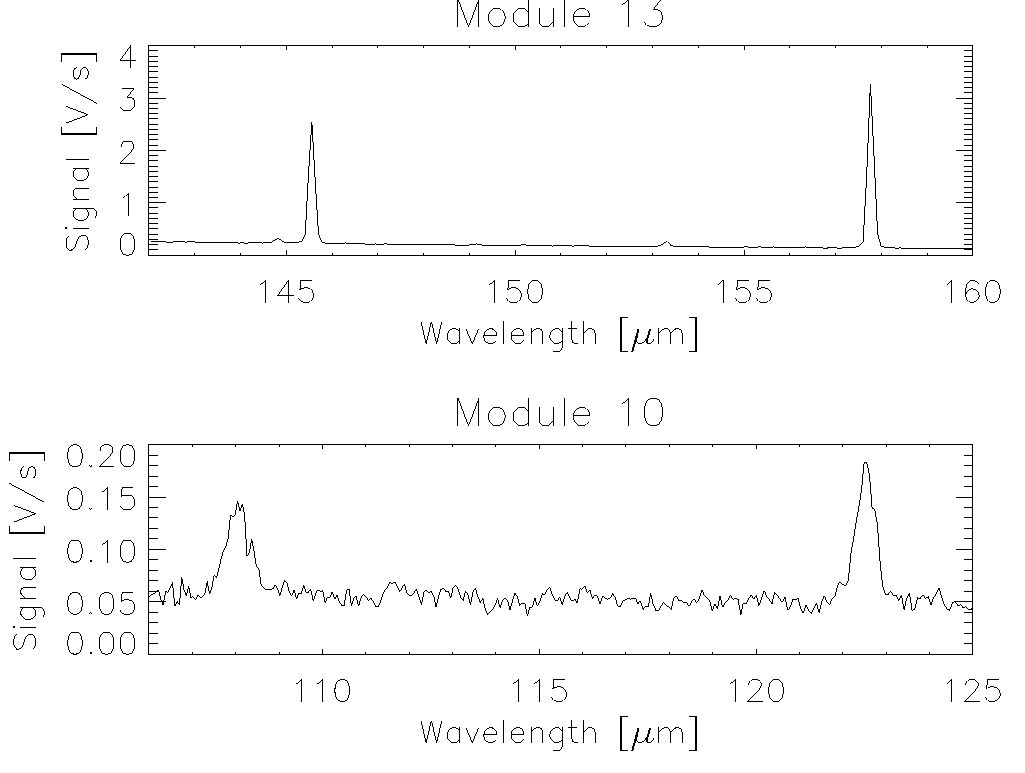
Figure 4.24. Example of the second pass spectral leak: the strong (real) line emission at 145.5 (OI) and 157.7 (CII) in module 13 leak into module 10, where they are seen as broadened spectral lines around 108 and 122 micron.
Table 4.2. Example 2nd pass ghost wavelengths corresponding to prominent fine structure lines in the PACS wavelength range
Spectral band | Parent line | Wavelength (micrometer) | Ghost wavelength (micrometer) |
|---|---|---|---|
B3A (50-70 micrometer) | OI | 63.2 | 54 |
B2B (70-100 micrometer) | OIII | 88.4 | 72 |
R1 (100-220 micrometer) | OI | 145.5 | 108 |
R1 (100-220 micrometer) | CII | 157.7 | 122 |
R1 (100-220 micrometer) | NII | 205.3 | 178 |