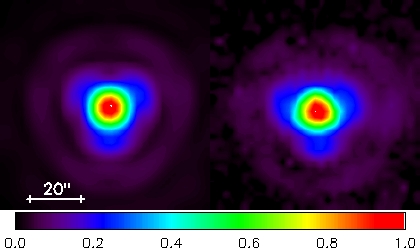
A further result of extended rasters on Neptune has been the verification of the point spread function of the spectrometer. Remarkable agreement with predictions from telescope and instrument modeling has been found. A measurement for a typical spatial pixel of the PACS spectrometer can be compared in Figure 4.8 and Figure 4.9 to a convolution of a calculated PSF (from actual telescope model including known wave-front errors) with a square pixel of 9.4"x9.4".
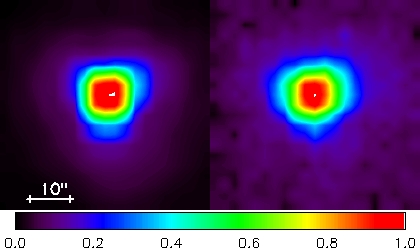
Figure 4.8. Calculated spectrometer PSF at 62 µm (left) and measurement on Neptune (right) done at the same wavelength. Both are normalised to the peak and scaled by square-root, to enhance the faint wing pattern. The calculation includes the predicted telescope wave-front error, which dominates the overall aberrations.
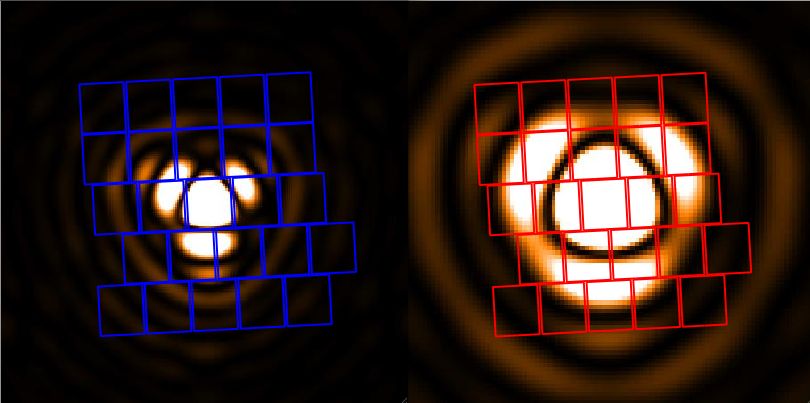
The PACS spectrometer spaxels sample a part of the PSF delivered by the Herschel telescope. The telescope PSF becomes larger with wavelength, and shows substantial departure from a Gaussian profile due to the telescope wavefront errors, mainly caused by the three-point mount of the telescope dish. At different wavelengths, different fractions of the PSF structure are seen by the different spaxels. This is illustrated in Figure 4.10 . Given the pointing accuracy of the spacecraft, this means that the fraction of the PSF falling onto the central spaxel can vary substantially. This is presently the main limitation of the flux calibration. The full wavelength-dependent characterisation of the PSF is ongoing at the PACS Instrument Contol Centre (P-ICC).
A full characterisation of the spectrometer beam efficiencies is ongoing. The beam efficiencies have been measured via raster maps on Neptune at a few selected wavelengths. The Neptune visibility window in spring 2011 is being used to complete these measurements at different wavelengths in every spectral band. Together with the detailed telescope PSF models this will allow us to provide reliable model beam efficiencies well sampled across the PACS spectral coverage. In Figure 4.11 the measured beam efficiencies are shown at 62, 75, 125 and 150 µm. The pixel size dominates the width of the beam efficiency up to 150 µm. Figure 4.12 shows the Gaussian width of the measured beams as a function of wavelength. The pixel size dominates the width of the beam efficiency up to 150um.
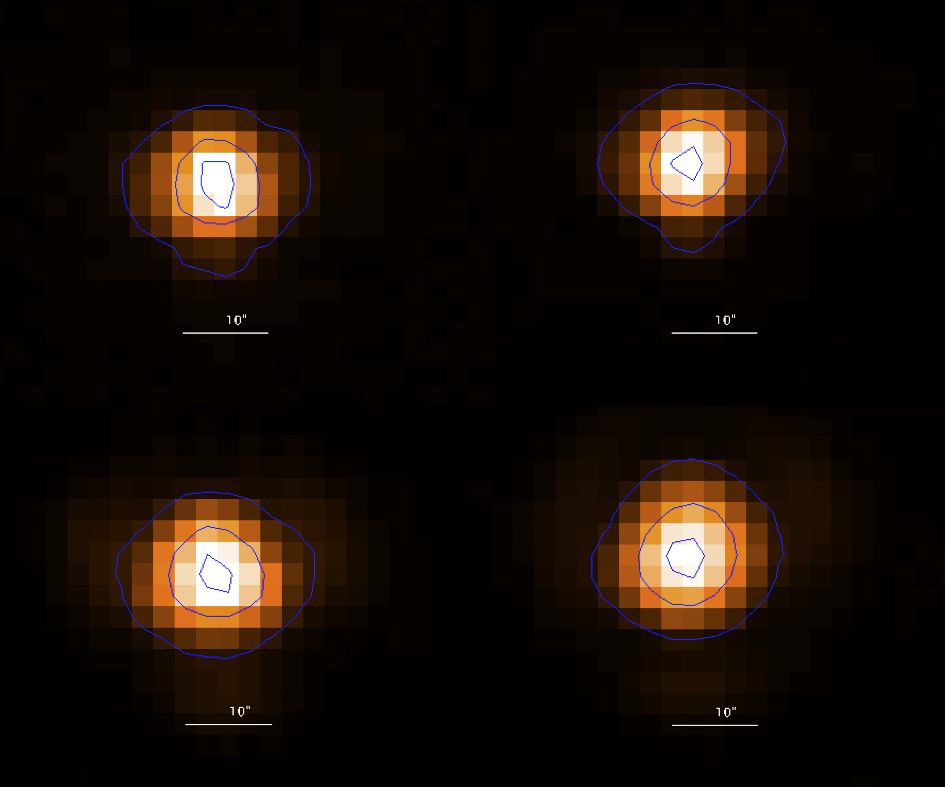
Figure 4.11. PACS spectrometer beam efficiency as measured from raster maps on Neptune. From top left, to bottom right: 62 µm, 75 µm, 125 µm, 150 µm. The contours indicate 10%, 50% and 90% of the peak response.
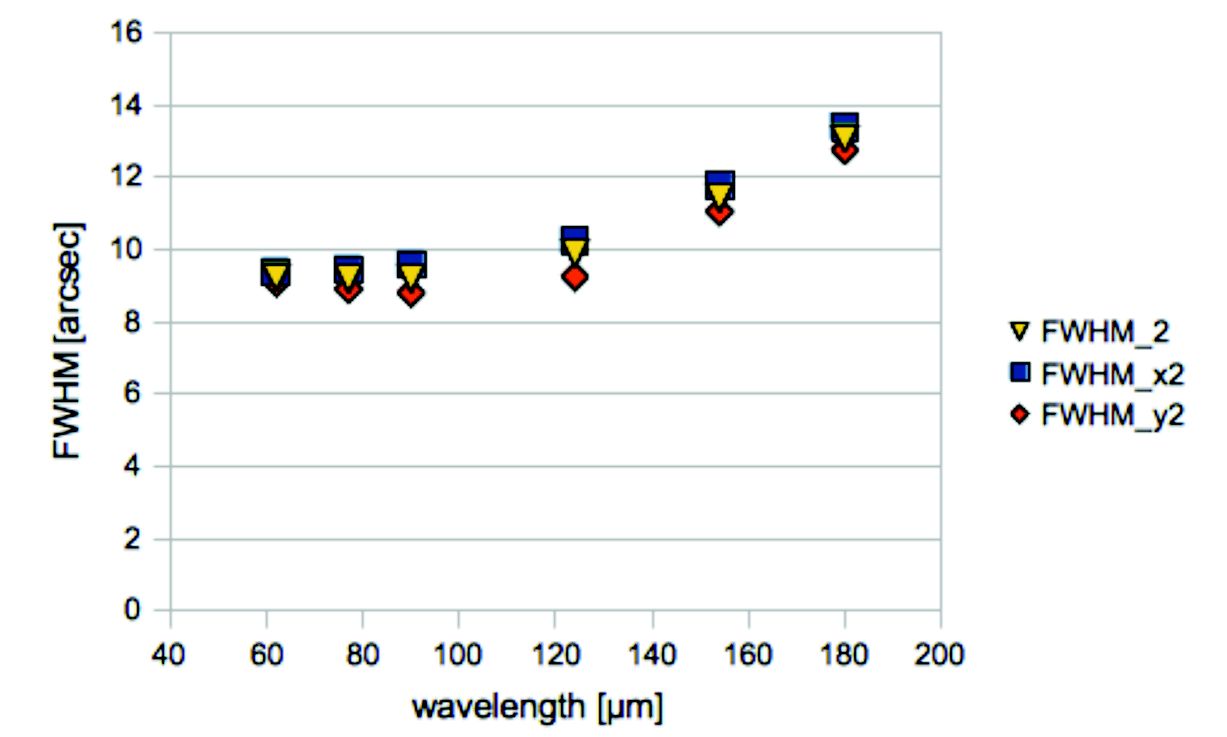
Figure 4.12. Width of the PACS spectrometer beams as a function of wavelength. We show the FWHM in two directions of the assymetric 2D Gaussian fit (blue squares, red diamonds) and the mean of the two (yellow triangles). Note that the beams are not Gaussian, these numbers are a rough indication of the beam size only.