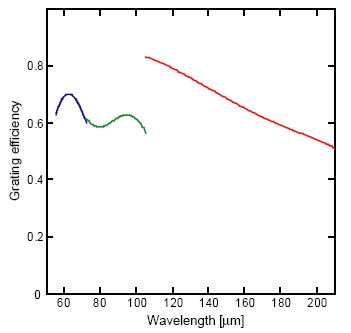
4.2. PACS spectrometer AOTs

Two different observation schemes are offered with the PACS spectrometer: line and range spectroscopy.

4.2.1. Line scan spectroscopy AOT

This AOT is intended to observe one or several unresolved or narrow spectral line features, on fixed wavelength range of about 1 micron (but varying from 0.35 to 1.8 µm depending on the wavelength and the grating order).

Only lines in the first (102-210 µm) and second order (73-98 µm), or first and third order (55-73 µm) can be observed within a single AOR, to avoid filter wheels movements. If lines of second and third grating order are to be observed on the same target at the same time, two AORs shall be concatenated. Depending on the requested wavelength/grating order, only the data of one of the two detector arrays is normally of interest to the observer.

The fixed wavelength and its immediate neighborhood is observed for each chopper and grating position. For improved flat-fielding, especially for long integrations, the grating is scanned by a number of discrete steps around a specified centre position such that drifts in the detector responsivity between individual pixels are eliminated.

These grating scans provide for each line and for each of the 5 by 5 spatial pixels a short spectrum with a resolving power of ~1700 in its highest resolution covering ~1500 km/s but dependent on the wavelength and order.

Up to 10 lines can be studied within one observation. The relative sensitivity between the lines is controlled by using the line repetition factor, in the line editor of the "wavelength settings" in HSpot, that allows to repeat a line scan several times. While the absolute sensitivity is controlled by the repetition factor in the "observing mode settings", by dedicating a larger amount of time to this observation (integer multiples).

Background subtraction is achieved either through standard chopping/nodding (for faint/compact sources) or through ‘frequency-switching’ techniques (for line measurements of bright extended sources) of the grating mechanism. The observer can select either chopping/nodding or frequency switching in combination with one of the three observing modes: pointed, pointed with dither and mapping.

For both observing mode settings, three pointing modes are offered:

  • Pointed mode: the default mode for point-source spectroscopy, a single pointing on the source. The integral-field concept allows simultaneous spectral and spatial multiplexing for the most efficient detection of weak individual spectral lines with sufficient baseline coverage and high tolerance to pointing errors without compromising spatial resolution. The PACS spectrometer arrays have 5 by 5 spatial pixels covering a squared 47 by 47 arcseconds field-of-view respectively, both channels viewing identical positions on the sky. The line flux from a point source object will always be collected with the filled detector array, with most the source flux falling on the central pixel. Therefore, for the plain detection of a line source, one pointing is sufficient

  • Pointed with dither: This mode is offered to take data for a point-like object in a very similar way as in the "Pointed" observing mode (see above). In order to improve the spatial sensitivity the spacecraft is commanded to three close positions perpendicular to the chopper direction. In such a configuration this observing mode can compensate for image slicer effects, especially important for faint targets. However as a consequence the minimum science time is increased by a factor three, the total duration of the AOR is 1100s with respect to only 470s in the pointed mode.

    The flux reconstruction of a (faint) point source might be improved with dither if the source position is uncertain, and/or if the source is slightly extended (pointing uncertainty). But clear guidelines cannot be given at this time on the advantage of "pointed with dither" over the simple pointed mode. Small rasters might be better anyway in these cases.

  • Mapping: This mode allows the observer to set up a raster map observation in combination with chopping/nodding or wavelength switching techniques.

    In chop/nod mode, the map can only be defined in spacecraft coordinates, and the map size shall be restricted to 6 arcminutes for clean offset positions with the large chopper throw for each raster position. The user is therefore advised to build a square raster map to be position angle independent, in other words to define a map with the same number of raster points and step sizes on the X and Y axis.

    [Note]Note
    Raster lines are performed along the Z-axis (in contrast to photometer raster map where raster lines are along the Y-axis), i.e. perpendicular to the chopping axis, as can be visualized in HSpot with the AOR overlay functionality.

    In wavelength switching mode the map can only be defined in celestial coordinates, with a maximum size of 2 degrees, and sparsely sampled maps are possible. The map "orientation angle" in the "Observing mode settings" HSpot panel is the angle from the celestial north to the raster line direction counterclockwise. If the user wants to cover a contiguous area in the sky, under any position angle he shall not define a step size larger than 34 arcsec, i.e. the size of the array (47") divided by 2.

    [Warning]Warning
    In mapping more, the sensitivity given by HSpot refers each single raster point and does not take into account internal redundancy. The sensitivity shall increase roughly with the square root of the redundancy factor (number of times a sky pixel is seen by a spectrometer spatial pixel).
    [Note]Note
    Exposure maps for the spectrometer are not yet available in HSpot, but shall be in a next version. It is advised to always visualize the AORs, with the AOR overlay functionality in HSpot, for different observing dates in the visibility windows to check the field coverage, especially in mapping mode.

4.2.1.1. Standard chopping-nodding mode

For each user defined wavelength, PACS performs an up/down grating scan with an amplitude such that a given wavelength is seen successively by all 16 spectral pixels. The sampling density is higher than 3 samples per FWHM at all wavelengths with 43, 46 and 48 grating steps in the first, second and third order respectively. This mode is called "chopping/nodding" in the "observing mode settings" panel of HSpot.

The principle of line spectroscopy is illustrated in Figure 4.12.

Visualization of the line scan AOT on an unresolved PACS line (here given by a Gaussian). The grating step used is the nominal one currently coded in AOT design. The left-hand side shows results for 16 grating steps (bright lines chopping-nodding mode case) the right-hand side shows the same for nominal grating positions (standard "faint lines" chopping-nodding) Top row is for a blue line at 60µm; bottom row is for a red line at 205µm.

Figure 4.12.  Visualization of the line scan AOT on an unresolved PACS line (here given by a Gaussian). The grating step used is the nominal one currently coded in AOT design. The left-hand side shows results for 16 grating steps (bright lines chopping-nodding mode case) the right-hand side shows the same for nominal grating positions (standard "faint lines" chopping-nodding) Top row is for a blue line at 60µm; bottom row is for a red line at 205µm.

Table 4.5. spectral coverage in line scan

diffraction order

wavelength (µm)

full range (km/s)

full range (µm)

highest sensitivity range (µm)

FWHM (µm)

3

55

1880

0.345

0.095

0.021

3

72

799

0.192

0.053

0.013

2

72

2658

0.638

0.221

0.039

2

105

1039

0.364

0.126

0.028

1

105

5214

1.825

0.875

0.111

1

158

2869

1.511

0.724

0.126

1

175

2337

1.363

0.654

0.124

1

210

1314

0.92

0.441

0.098

The full wavelength ranges covered by the scan and the ranges covered to the highest sensitivity, i.e. the wavelength seen by all 16 spectral pixels are shown in Table 4.5 and compared with respective FWHM of the spectrometer at these wavelengths, for an unresolved line.

Chopping and nodding is imposed by the design of the AOT, in other words if chopping/nodding is deselected, the frequency switching is selected instead (see following section), as both observing techniques are mutually exclusive. A classical 3-positions chopping/nodding is performed to eliminate inhomogeneities in the telescope and sky background.

Three chopper throws are available: "Small", "Medium" and "Large" refer to 1, 3 and 6 arcmin chopper throws on the sky respectively. The chopping direction is determined by the date of observation, the observer has no direct influence changing this parameter. In case some disturbing sky features would fall in within the chopper throw radius around the target, the observer has to consider to setup a chopper avoidance angle constraint. The angle can be specified in Equatorial coordinates counterclockwise with respect the celestial north. The avoidance angle range can be specified up to 360 degrees with a minimum range of 15 degrees, to avoid too much constraints on mission planning.

[Note]Note
Setting up a chopper avoidance angle requires an additional constraint on mission planning, therefore this parameter should have to be used only for observations where it is absolutely necessary.

Up to 10 up/down scans can be performed per nod position, for different lines and/or repeating a given line several times, allowing to cover some lines to different depths. The PACS focal plane chopper is moved between the on-target and the off positions during the scan(s). Then the whole sequence of spectral line scans is repeated in the nod position. In total, one half of the science time is spent on-source.

The absolute sensitivity is controlled by dedicating a larger amount of time to a given observation, i.e., by repeating the nodding cycle AB or ABBA more times.

In order to take advantage of the best spectrometer sensitivity a ramp length of 64 readouts (1/4sec ramps) has been selected; two ramps per chopper plateau are foreseen and one chopper cycle per grating position.

4.2.1.2. Bright lines chopping-nodding mode

This mode is devoted to bright lines where it is not needed to spend as much time per line as in the standard chopping/nodding mode. Up and down grating scans are performed but only with 16 grating steps, i.e. an on-sky time about 5 shorter than in the standard chopping/nodding mode.

The principle of line spectroscopy is illustrated in the left-hand side of Figure 4.12.

The observing efficiency of this mode is rather poor because of fixed incompressible overheads. The minimum observing time (one line, one cycle) is 274s versus 450s in the standard chopping/nodding, while it is a little less twice less sensitive. If several lines are observed the modes becomes more attractive.

[Warning]Warning
Latest instrument ground tests have shown that the time spent per grating position in this mode is too low. As a consequence a a minimum repetition factor of 2 shall be entered in HSpot for AORs in "chopping/nodding (bright lines).

4.2.1.3. Line scan in wavelength-switching mode

The wavelength switching technique/mode is an alternative to the chopping/nodding mode, if by chopping to a maximum of 6 arcminutes, the OFF position field-of-view cannot be placed out of an emission free area, for instance in crowded areas. Wavelength switching shall also be considered for very bright objects, typically solar system objects, where chopping to an off-position could introduce a considerably high contrast, resulting from memory effects in the spectrometer's Ge:Ga detectors. Such an effect would lead to poorly calibratable data.

In wavelength switching mode the grating moves the line alternatively on the 16 spectral pixels, between two positions separated by 8 pixels. In this scheme the line always stays on the 16 spectral pixels, in one position the red part of the line is covered on the other the blue part. The principle of wavelength switching spectroscopy is illustrated in Figure 4.13.

Visualization of the wavelength switching mode for a line at 70.515 µm. The peak of the line is shifted alternatively by the grating between pixels 4 and 12 approximatively. The 1/4 pixel dithering is not shown here for a purpose of clarity.

Figure 4.13.  Visualization of the wavelength switching mode for a line at 70.515 µm. The peak of the line is shifted alternatively by the grating between pixels 4 and 12 approximatively. The 1/4 pixel dithering is not shown here for a purpose of clarity.

A 7-positions spectral dithering is also implemented (shifting sequentially the line by a quarter of a pixel), to improve the reconstruction of the (unresolved) line profile, and the two calibration source are also observed shortly for each dither position to monitor the possible drift in sensitivities.

The frequency switching mode is more efficient than chopping/nodding mode, because the line stays always on the array and only 40% of the time is spent on the calibration sources. As a consequence this mode takes less time than the standard chopping/nodding scheme (about 2mn per cycle) for a predicted sensitivity slightly better.

Wavelength switching can be used for large extended sources since no clean reference is needed. But it shall be used with caution: by definition this technique eliminates the continuum information. Besides the baseline estimates will not be reliable if:

  • a noticeable gradient is present in the continuum flux over the performed wavelength throw,

  • blends of line forests disturb the wavelength switch interval.

In the frequency switching mode, the observer shall also check the available spectral information of galactic extended sources as diffuse molecular clouds, bright cirrus fields, star forming regions, photo-dissociation regions, photo-ionized regions in the vicinity of the selected line.

It is not advised to use frequency switching close to grating order cut-offs or with a switch into a neighboring order, as it might be difficult to calibrate.

[Warning]Warning
Although the wavelength switching mode is currently available in "pointed" and "pointed with dither" in HSpot, this option will be disabled in the future. Wavelength switching shall only be used in combination with the mapping pointing mode, with a minimum raster size of 2 x 2.

4.2.2. Range scan spectroscopy Mode

Similarly to the Line scan spectroscopy mode, this AOT allows to observe one or several spectral line features (up to ten), but the user can freely specify the explored wavelength range.

This AOT is mainly intended to cover rather limited wavelength ranges up to a few microns in high sampling mode (see below) to study broad lines (larger than a few 100 km/s), which wings would not be covered sufficiently in Line Spectroscopy AOT, or a set of closed lines. But in the second case the relative depth of the line cannot be adjusted as in the Line Spectroscopy case.

[Note]Note
Contrary to the Line spectroscopy AOT, there is no way to adjust the range with a redshift for a broad line. The user has to computed the redshifted range his wants to cover.

The Range Spectroscopy AOT is also intended to cover larger wavelength ranges up to the entire bandwidth of PACS (in SED mode) in low-sampling mode this time, otherwise integration times get quickly prohibitive. But one should remember that the power of the PACS spectrometer is its high spectral resolution rather than continuum sensitivity.

The use of the chopping/nodding is imposed by the design of the AOT, except in mapping mode where instead an off position can be defined if chopping/nodding is de-selected. In this case only chopping is performed on one of the calibration source and the background subtraction shall be done with OFF position. The chopping/nodding uses the same pattern as in line spectroscopy, with a 3-positions chopping/nodding to eliminate inhomogeneities in the telescope and sky background. As in Line scan spectroscopy, only ranges in first (102-210 µm) and second order (71-98 µm), or first and third order (55-73 µm) are allowed within a single AOR.

[Note]Note
If ranges in the second and third order are to be covered at the same time then two AORs ought to be concatenated.

As in line spectroscopy the spacecraft may be used in one of the three pointing mode: pointed mode, pointed with dither mode or in mapping (raster) mode. In mapping mode the raster map can be oriented with respect to the celestial north, as in Line spectroscopy / wavelength switching mode.

[Note]Note
Refer to the section line spectroscopy for the usage of these 3 pointing modes and their current limitations.

As in line spectroscopy, three chopper throws are available: "small" (1 arcmin), "medium" (3 arcmin) and "large" (6 arcmin), except in the mapping mode, where only the large chopper throw is allowed, in order to chop out of the map. In this case the map size is also limited to 4 arcmin, except if an off-position is selected.

4.2.2.1. Raster mapping in range scan

Raster maps in range spectroscopy defined with chopping/nodding are performed in instrument coordinate system, i.e. with raster lines along the spacecraft Z-axis (i.e. perpendicular to the chopping axis).

As the position angle will depend on the observation day, it is advised to define square maps in order to get a mapped area of interest independent of position angle, i.e. same number of raster points and step sizes on both axis. Otherwise a chopper avoidance angle can be set or a timing constraint to orient the small map. As in line spectroscopy, the size of a map defined in chopping/nodding is limited to 6x6 arcmin to avoid chopping in the map.

On the other hand raster maps defined with an OFF position are defined in sky coordinates, using the map orientation angle parameter, counted from the north to the raster line direction counterclockwise in the sky. In this mode no nodding is performed, the background is measured with the OFF position instead. Chopping is still performed but internally on the calibration source 1.

Two observing modes are available: the range scan mode and the SED mode.

4.2.2.2. Range scan

A number of wavelength ranges (low and high wavelength pairs) have to be entered either in the 71-98 and 102-210 µm interval (2nd and 3rd order) or in the 55-73 and 102-210 µm interval (3rd and 1st order)

Two different sampling densities of the up/down scan are offered:

  • either the high sampling density, the same as in line spectroscopy but here for arbitrary ranges, corresponding an objectives of more than 3 samples per FWHM of an unresolved line in each pixel at all wavelengths)

  • or the Nyquist sampling (considering the 16 spectral pixels), with grating step size of 6.25 spectral pixel.

In "high sampling density" mode integration times can be very long, for instance a full up/down scan in the first order takes more than 5 hours. If the time scale of the detector drifts turn out to be shorter than expected, such long scans might not be advised, as the time spend on one nod position will be too long.

In order to increase the depth of range scans, even for relatively short ranges, it is advised to increase more the number of nodding cycles rather than the range repetition factor, in case the timescale of the drifts in detector sensitivities are short, as they will be better corrected with shorter nodding cycle durations.

The Nyquist sampling shall therefore be the default for large wavelength range coverages as it allows obviously faster scans than the high sampling density option but at the expense of sensitivity.

[Warning]Warning
Latest instrument ground tests have shown that the time spent per grating position in Nyquist sampling mode is too low. As a consequence a a minimum repetition factor of 2 shall be entered in HSpot for AORs using range scans in Nyquist sampling mode.

The sensitivities for the SED mode and high-sampling density mode mode are displayed in Section 3.5.7 for a single up-and-down scan and one nodding cycle.

Wavelength as a function of spectrometer grating position

Figure 4.14. Wavelength as a function of spectrometer grating position

Figure 4.14 shows the parallel ranges covered for a primary defined wavelength range. Note that this information is provided directly in HSpot version 3.0 onwards. But sensitivity plots can now be generated on-line with HSpot 3.0 onwards including for the parallel range(s) in the other spectral orders covered simultaneously and "for free". The parallel ranges can also been estimated quickly with Figure 4.14.
  • for every scan range defined in the 2nd or 3rd order there is a parallel scan covered in the 1st order.

  • for a scan defined in the 1st range there might 0, 1 or 2 parallel ranges in the 2nd and 3rd orders.

4.2.2.3. SED mode

This observing mode is intended to cover the full PACS wavelength range in Nyquist sampling to get the far-infrared SED (Spectral Energy Distribution) of a target.

Three full wavelength ranges are offered:

  • 'SED red' (first and second diffraction orders), 71 to 210 µm.

  • 'SED blue', in the range 55 and 73 µm in the third grating order, together with a long wavelength parallel range in the 1st order (165-210 µm).

  • 'SED blue high sensitivity', in the range 60 and 73 µm only in the second grating order together with a long wavelength parallel range in the 1st order (180-210 µm). This scan offers a better continuum sensitivity in this range than the 'SED blue' mode, but a worse line sensitivity because of the much worse spectral resolution of the 2nd order compared to the 3rd order.

[Note]Note
To cover the full PACS spectrometer wavelength range (55-210 µm), two AORs in 'SED red' and 'SED blue' have to be concatenated.
[Note]Note
The red and blue SED modes are completely equivalent to the range scan mode in Nyquist sampling density with a full wavelength range.
[Warning]Warning
Latest instrument ground tests have shown that the time spent per grating position in SED mode (that uses the Nyquist sampling mode) is too low. As a consequence the user is asked to enter a repetition factor of at least two for a proper measurement. Hence the total duration of an SED observation with two concatenated AORs (SED red and SED blue) shall take slighty more than one hour.