For all targets, the main components of background are the zodiacal light (at short wavelengths, with only slow angular variations and little granularity) and the Interstellar Medium (ISM) at longer wavelengths (with much greater granularity). For a fixed target the ISM will have a fixed value at any wavelength, being highest for targets in the Galactic Plane and the zodiacal light will vary with ecliptic latitude and solar elongation. For a moving target the ISM background will, logically, vary with time, although these variations will be a function of the object's heliocentric and geocentric distance -- for distant planets the time variations will be slower but, as a corolary is that an object will take longer to escape from a region of bad (bright, or highly structured) background. The classic case of this was the observation of (134340) Pluto, which crossed the Galactic Plane in Sagittarius, close to the Galactic Centre, in December 2009 and then again in August and October 2010. As Figure 6.5, “An illustrative example of a case where orientation constraints were essential. The Galactic Plane mapping programme -- HiGal -- required interlocking tiles around the full 360 degrees of the galactic Plane. This was achieved by setting an orientation contraint so that the 2x2 degree tiles would align horizontally. When the orientation constarint was relaxed slightly to ease scheduling problems, a tile would appear rotated; this was the case for the fourth tile in this strip of the Milky Way from Galactic Longitude 319 to 310 degrees from Centaurus to Crux.” shows, the Galactic Plane is a region of extremely bright and complex emission, so (134340) Pluto observations had to be delayed until late in the mission when it had pulled sufficiently away from the Plane, to avoid the densest interstellar dust emission (see Figure 6.7, “The path of (134340) Pluto between 2011 and the end of the mission superimposed on an IRAS image (red channel is 100 microns, green channel is 60 microns, blue channel is 25 microns). In 2011 it was embedded still deep in the clouds of the Galactic Centre region, making it essential to observe it as late as possible before the End of Helium, as it climbed southwards out of the Galactic Plane.”).
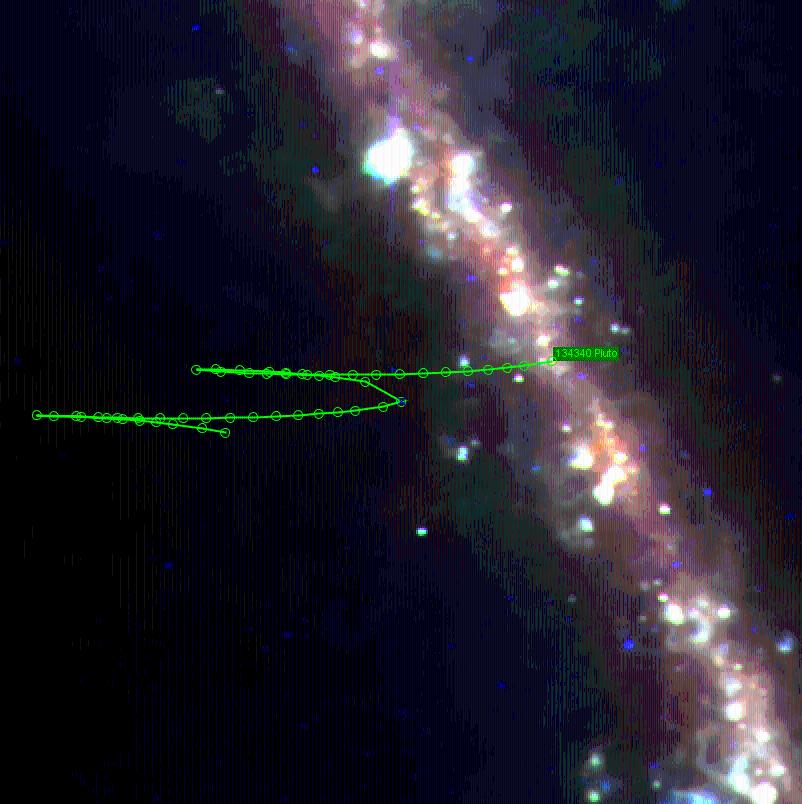
Figure 6.7. The path of (134340) Pluto between 2011 and the end of the mission superimposed on an IRAS image (red channel is 100 microns, green channel is 60 microns, blue channel is 25 microns). In 2011 it was embedded still deep in the clouds of the Galactic Centre region, making it essential to observe it as late as possible before the End of Helium, as it climbed southwards out of the Galactic Plane.
Note that, like its terrestrial equivalent, Infrared Cirrus is highly structured and this structure will affect observations of faint targets. For very faint solar system targets, or where high signal-to-noise is essential, a careful examination of the cirrus may have been necessary to look for a hole in the background that would allow deeper observations; once a suitable hole was identified, a time constraint could be put on the observations to ensure that they were made against it -- HSC Mission Planners always made great efforts to satisfy such requests, when properly justified.
As an example, the following shows how the PA (Figure 6.8, “PA variation for a typical solar system object: Neptune's satellite Triton. Note how the PA variations over the course of a full observing window amount to less than 2 degrees. This made it effectively impossible to accomodate map orientation or chopper angle avoidance constraints. Although this example was calculated originally for a Herschel launch in 2007, the amplitude and timescale of variation remains the same for the actual launch date.”) and the estimated background at 80 microns (Figure 6.9, “The background variation for Triton at 80 microns. The background is dominated at this wavelength by the Zodiacal Light contribution. As the elongation changes over the course of the observing window the background effectively doubles with time. At longer wavelength the ISM component will also change as the target moves across areas of different background. For objects relatively close to the Sun the ISM component may vary enormously in a comparatively short space of time. Although this example was calculated originally for a Herschel launch in 2007, the amplitude and timescale of variation remains the same for the actual launch date.”) varied through a visibility window for the satellite Triton of Neptune (NAIF ID 801). At this wavelength the zodiacal light dominates and increases as the solar elongation decreases. Note too how the PA barely changes over the duration of an observing window, meaning that the chopper throw was almost fixed in direction with time; this had strong implications for any potentially orientation-constrained observations.
Figure 6.8. PA variation for a typical solar system object: Neptune's satellite Triton. Note how the PA variations over the course of a full observing window amount to less than 2 degrees. This made it effectively impossible to accomodate map orientation or chopper angle avoidance constraints. Although this example was calculated originally for a Herschel launch in 2007, the amplitude and timescale of variation remains the same for the actual launch date.
Figure 6.9. The background variation for Triton at 80 microns. The background is dominated at this wavelength by the Zodiacal Light contribution. As the elongation changes over the course of the observing window the background effectively doubles with time. At longer wavelength the ISM component will also change as the target moves across areas of different background. For objects relatively close to the Sun the ISM component may vary enormously in a comparatively short space of time. Although this example was calculated originally for a Herschel launch in 2007, the amplitude and timescale of variation remains the same for the actual launch date.
Note that for satellites of solar system objects HSpot only calculates the visibility window with a solar elongation criterion. It does not take into account if the object was genuinely observable by Herschel. It was the astronomer's responsibility to make the necessary checks. Many solar system satellites experience transits and occultations by their parent planet. Similarly, a satellite may not be resolved at the wavelength of observation, or instrument safety constraints may have made it impossible to observe a satellite when at less than a certain elongation from the parent planet, or may have permitted it to be observed only on one side of the planet. Please contact Helpdesk (http://herschel.esac.esa.int/esupport/) for specific, detailed enquiries about this topic.
![[Warning]](../../admonitions/warning.gif) | Warning |
|---|---|
| In photometry mode, instrument safety did not allow Jupiter or Saturn to enter the field of view at any point of the observation and scattered light may be a severe problem even with the planet out of the field of view. |
As an example, the following plots show how the elongation of Io, Jupiter's innermost Galilean satellite (NAIF ID 501), varies from the centre of the disk of Jupiter. In the first plot (Figure 6.10, “The variation of the elongation of Io from the centre of Jupiter with time. The area in grey is the region when Io is either superimposed on the disk of Jupiter (in transit) or behind the disk of Jupiter (occulted). HSpot does not warn the user if the visibility of a planetary satellite is limited in this way. Even when not confused with the disk of the planet, a satellite of Jupiter may not have been visible due to parasitic light from the planet, or to the danger of the planet impinging on the detector. All observations of the satellites of Jupiter and Saturn had to be made with extreme care to ensure that the planet did not enter the field of view.”) we see how the elongation varies with time over part of a visibility window. In the area marked in grey the satellite is either in transit, or occulted and thus, by definition unobservable. The second plot (Figure 6.11, “The variation in the offset of Io from the centre of Jupiter through an entire visibility window. The grey ellipse represents the approximate mean size of the disk of Jupiter. Note that the entire area of this plot is smaller than the field of view of either PACS or SPIRE. If requesting observations of a planetary satellite the observer needed to check the visibility of the satellite using the JPL Horizons program at the url: http://ssd.jpl.nasa.gov/horizons.cgi.”) shows the offsets in R.A. and Dec. (in arcseconds) over a full observing window. The ellipse marks the approximate size of the disk of Jupiter which suffers a variation of about 10% with time. Note that the entire area of the plot is smaller than the PACS or SPIRE instrument array (see Table 3.1, “The main imaging capabilities of PACS and SPIRE. Please note that the wavelength range of detector sensitivity is approximate and the instrument sensitivities depend on the observing mode, so the values given are only orientative: please consult the relevant observing manual for more detailed values.”).
Figure 6.10. The variation of the elongation of Io from the centre of Jupiter with time. The area in grey is the region when Io is either superimposed on the disk of Jupiter (in transit) or behind the disk of Jupiter (occulted). HSpot does not warn the user if the visibility of a planetary satellite is limited in this way. Even when not confused with the disk of the planet, a satellite of Jupiter may not have been visible due to parasitic light from the planet, or to the danger of the planet impinging on the detector. All observations of the satellites of Jupiter and Saturn had to be made with extreme care to ensure that the planet did not enter the field of view.
Figure 6.11. The variation in the offset of Io from the centre of Jupiter through an entire visibility window. The grey ellipse represents the approximate mean size of the disk of Jupiter. Note that the entire area of this plot is smaller than the field of view of either PACS or SPIRE. If requesting observations of a planetary satellite the observer needed to check the visibility of the satellite using the JPL Horizons program at the url: http://ssd.jpl.nasa.gov/horizons.cgi.
When requesting observations of a planetary satellite the observer should have checked the visibility of the satellite using the JPL Horizons program at the url: http://ssd.jpl.nasa.gov/horizons.cgi. The ephemeris should be requested specificially for the "Herschel Space Observatory" (site code "500@-486). The observations will almost certainly have to have been entered in HSpot with a time constraint save for small, distant satellites, to avoid the planet entering the field of view, or to reduce stray light; for example, observations of Titan were limited to periods around greatest elongation, with the satellite more than 150 arcseconds from the centre of the planet.