Table of Contents
Herschel has been an observatory mission. Thus, as in ground-based telescopes, the astronomer who has requested the observations has had provide all the information necessary to carry them out. These instructions are known as an "Astronomical Observation Request" (AOR), which is made using a standard Astronomical Observing Template (AOT) (see Section 6.4, “AOT entry”). This information was then converted into spacecraft and instrument commands that were uplinked to the spacecraft to execute the observations. An additional complication with Herschel was that communication with the satellite was normally limited to 3 hours each day, so that all the commands to carry out observations had to be uplinked at least 48 hours in advance of the observations being carried out and had to be executed autonomously. This means that far more detail had to be defined by the observer than for observations in a normal groundbased telescope where details such as the exposure time can be modified at any time. The system was designed to make the highly complex process of defining observations as simple as possible for the observer. The following section describes this process.
Herschel was not planned as a survey mission, thus its sky coverage is neither complete, nor homogenous. Herschel observed the areas of the sky that were requested by its users and approved for observation by HOTAC, with no effort to fill in the gaps. Some areas have been covered to great depth, others have rather shallow coverage as a function of the observations that were executed and their aims. Similarly, there was a mix of pointed and mapping observations.
Overall, 9.7% of the sky was covered by Herschel to varying depths with 37 000 science observations taken over 1446 ODs from launch to EoH. You can play and download a 48-second video prepared by Pedro Gomez of the HSC, entitled "Mission Incredible", showing how the 37 000 observations were taken and the sky areas covered, by clicking on this link: http://spaceinvideos.esa.int/Videos/2013/11/Herschel_s_37_000_science_observations. Time -- measured in both UT and ODs -- is shown at the top of the screen, while the labels of all the AORs to be scheduled scroll across the bottom of the screen and the planets move along the ecliptic.
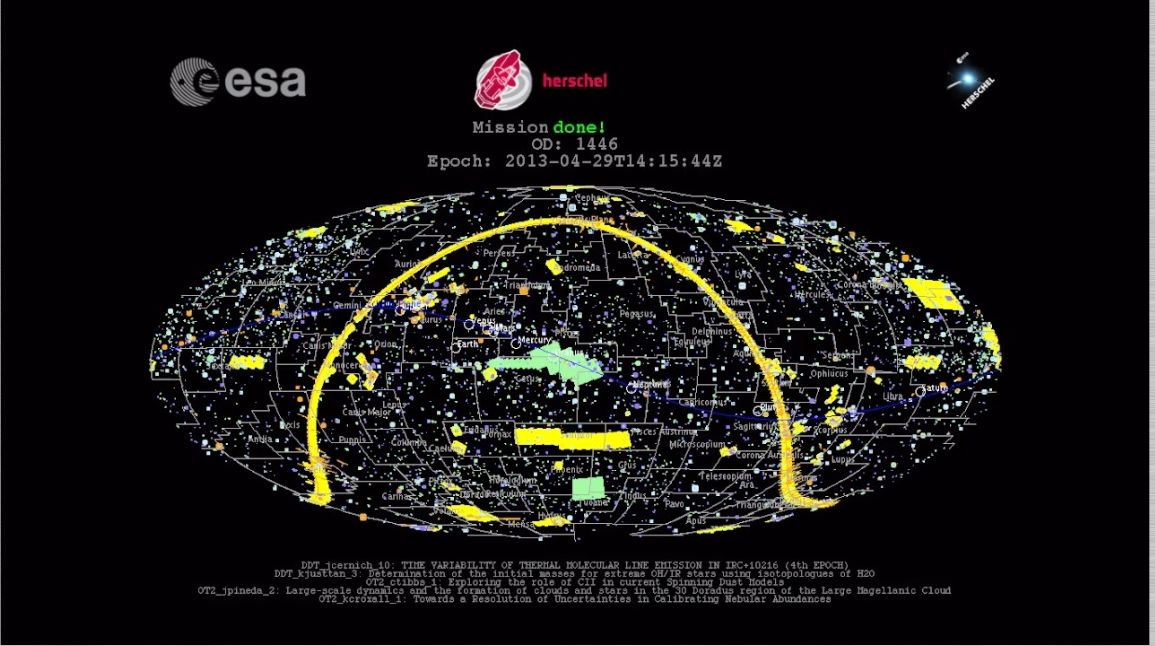
Figure 6.1. The final state of Herschel sky coverage. All 37 000 successful Herschel science observations are represented with their correct sizes. It is immediately obvious that, although the AOR centres are remarkably homogenously distributed around the sky (see Figure 3.8), in terms of actual sky area covered, the sky coverage is quite variable, with certain areas such as the Galactic Plane and Galactic Poles particularly well covered.
The final state of sky coverage is shown in Figure 6.1, with all 37 000 science observations represented. Although the AORs centres are remarkably homogeneously distributed on the sky (see Figure 3.8), in terms of sky area covered, the Galactic Plane, Ecliptic and Galactic Poles are all particularly well covered. There are also a few areas of the sky where there are very few observations, such as the constellation of Lacerta or the large hole in Auriga/Lynx.