The full wavelength range of Herschel was covered by six broadband (Δλ/λ=3) filters. In SPIRE, all three filters (250, 350 and 500 μm) were imaged simultaneously on three spiderweb bolometer arrays. PACS users were able to image with a "red" (130-210 μm) and a "blue" (either 60-85 or 85-130 μm) filter simultaneously on two bolometer arrays.Colloquially, but inaccurately, the 130-210, 85-130 and 60-85 micron filters are often referred to as the PACS "red", "green" and "blue" channels.
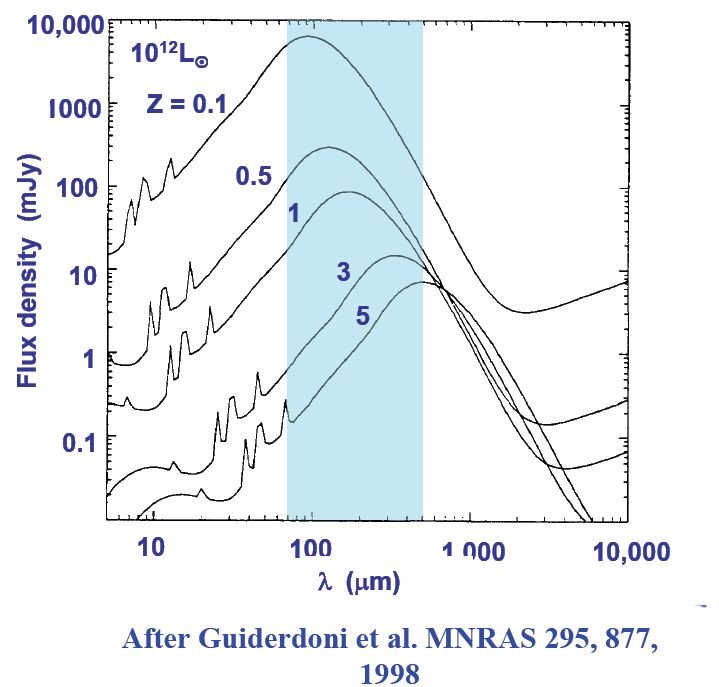
Figure 3.2. The black body spectrum of the far infrared dust peak of a star-forming galaxy of 10 solar masses showing the effect of redshift on the spectrum. At z=5 the peak moves to the long-wavelength end of Herschel coverage with SPIRE. The result of this is that the colour of a galaxy in a SPIRE RGB image gives a good estimate of its redshift and thus distance, with strongly red galaxies in SPIRE image being the most distant.
This has made Herschel a superb instrument for multicolour surveys. SPIRE could image a square degree of sky to an instrument noise equal to the extragalactic confusion limit (1 sigma) in 2.3 hours: a 60x60 arcminute large map with SPIRE with 2 repetitions would reach the confusion noise at 1 sigma in this time and, of course, much larger areas of the sky to a lesser sensitivity. Due to the overheads involved in scan maps (i) making large maps was more efficient than making small maps and (ii) making square maps, or maps with a small aspect ratio was somewhat more efficient than making long, thin strip maps, as the overheads implicit in long scans were reduced: a one square degree map made as a 60x60 arcminutes square would take 8186s, including overhead. A one square degree map taken as a 200x18 arcminutes strip would take 10564s, including overhead.
The main imaging capabilities are summarised in Table 3.1. As dust is a strong tracer of star formation (see Figure 3.2), one of Herschel's greatest strengths has been the possibility to study the history of star formation in the universe. By combining PACS and SPIRE data, users are able to follow the dust emission signature of starbursts redshifted to increasing wavelengths in ever more distant galaxies; this has made Herschel an enormously powerful facility for studying the formation and evolution of galaxies.
Observations with Herschel give a new insight into the process of star and planet formation. Herschel could study both the processes of star formation in molecular clouds and the debris disks that are the tracer of planetary system formation in young stars. Prior to Herschel's launch, few debris disks were known; observations with Herschel, with its wide wavelength coverage, have allowed many more to be detected and studied (Figure 3.3). Similarly, Herschel observations are valuable in the study of the later phases of stellar evolution, particularly circumstellar shells (Figure 3.4), mass-loss in general and stellar winds.
Finally, Herschel is a powerful tool for studying the physics of the more distant and colder objects of the solar system: such as the atmospheres of the giant planets (Figure 3.6), their icy satellites, cometary nuclei and cometary atmospheres. Herschel observations are permitting the albedos and thus the surface conditions and diameters of these bodies to be measured with great precision.
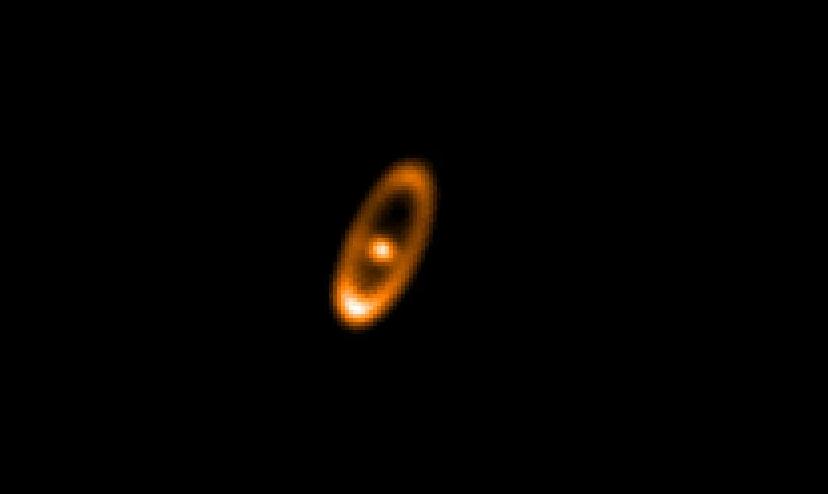
Figure 3.3. A PACS 70 micron image of the debris disk around Fomalhaut. The debris disk is well resolved. This is one of the few cases where Herschel also detects a hot star as, at 16 light years distance, Fomalhaut is close enough to be strongly detected at short wavelengths.
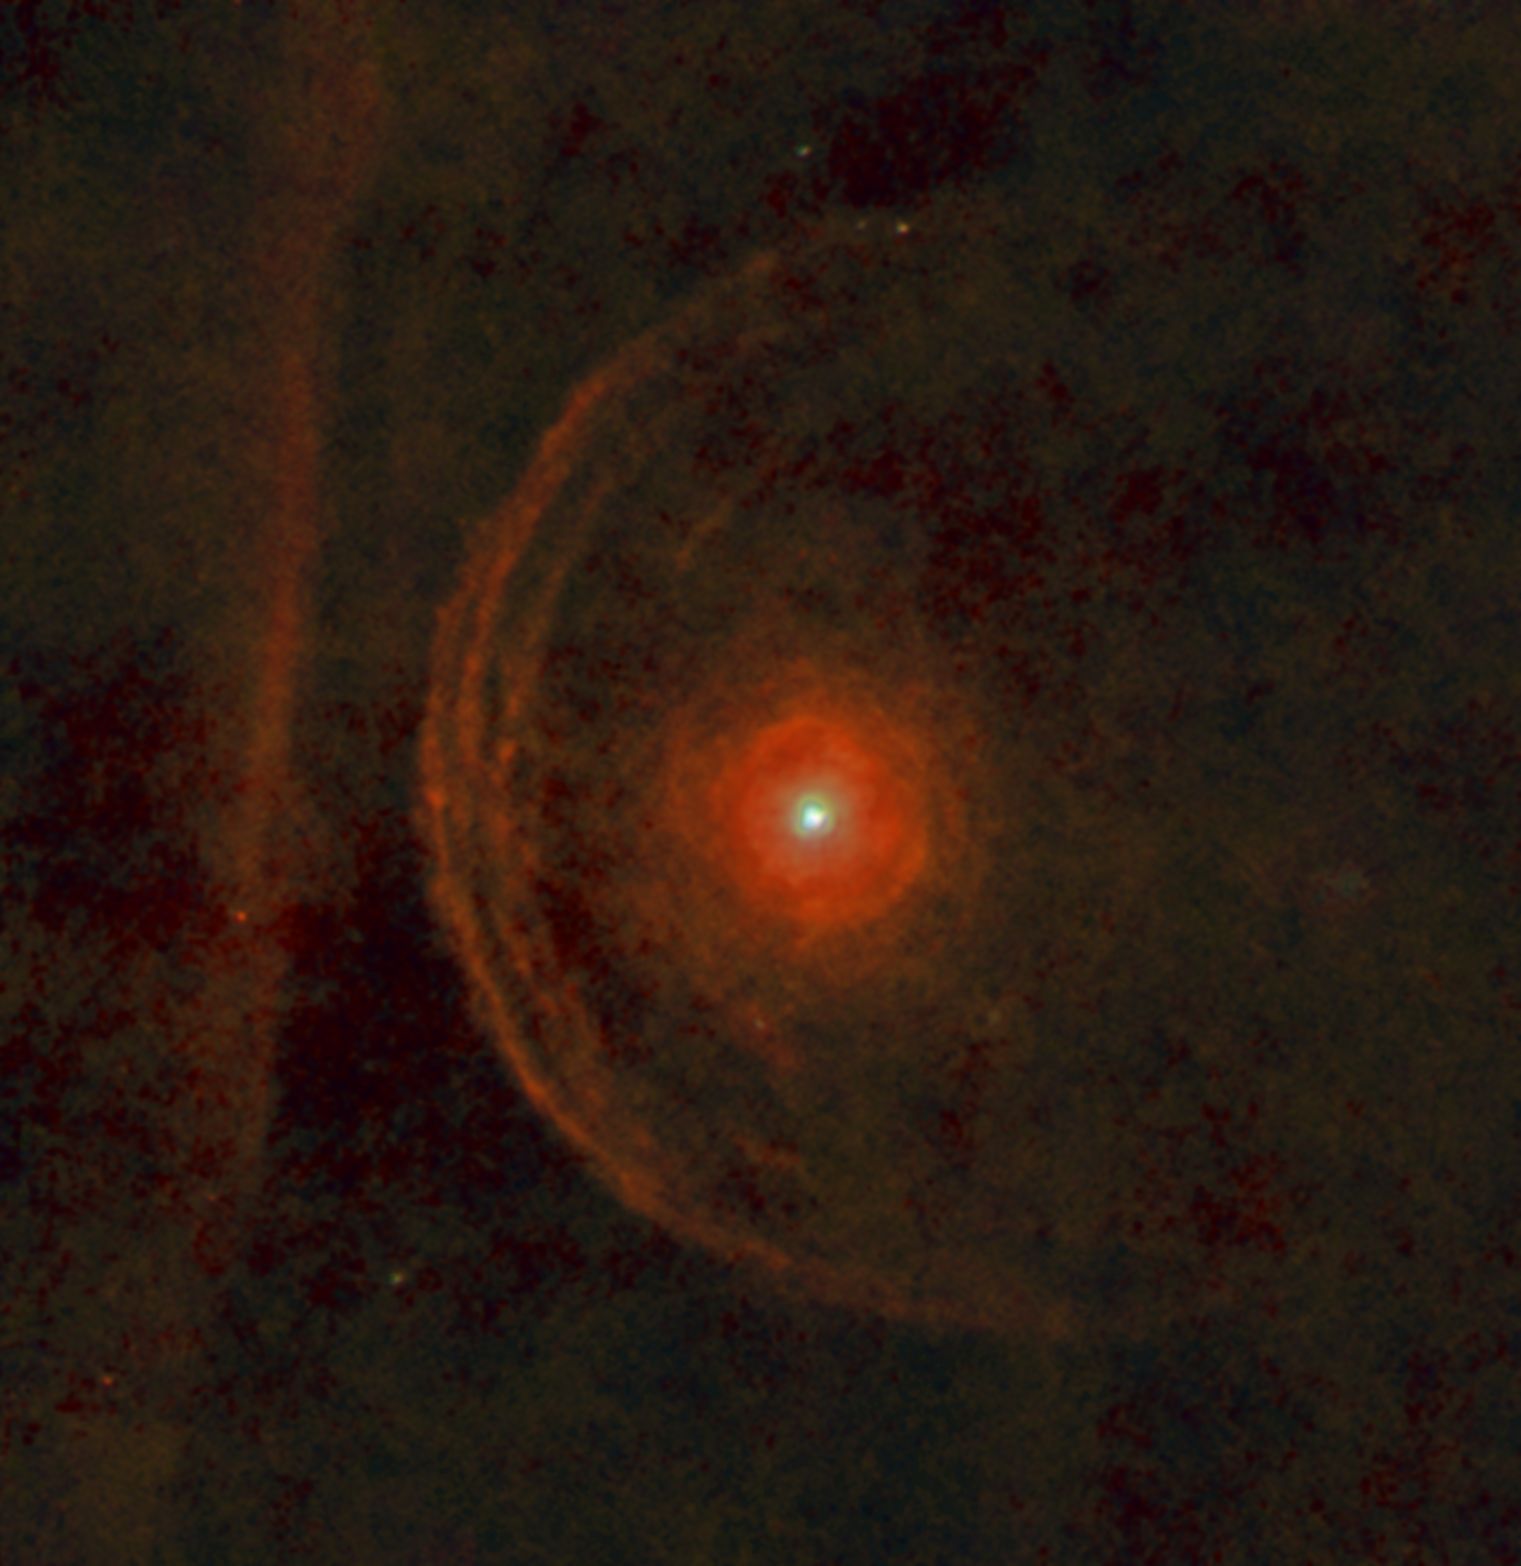
Figure 3.4. An RGB image of Betelgeuse and its environment constructed from PACS images at 70, 100 and 160 microns. North is to the top left and east to the bottom left in this view. A series of arcs can be see to the left (northeast) of the star; these are shells of material shed by the star in its supergiant phase. An intriguing feature of this image is the vertical bar to the left, which it is hypothesised may be the edge of an interstellar cloud that is being illuminated by the star; if so, the outer shell will collide with it in approximately 5000 years.
Table 3.1. The main imaging capabilities of PACS and SPIRE. Please note that the wavelength range of detector sensitivity is approximate and the instrument sensitivities depend on the observing mode, so the values given are only orientative: please consult the relevant observing manual for more detailed values.
| PACS | SPIRE | |
| Wavelength range | 60-210 μm | 200-670 μm |
| Field of view | 1.75x3.5' | 4x8' (unfilled) |
| Pixel size | 3".2 (60-130 μm), 6".4 (130-210 μm) | 18".2 (250 μm), 24".9 (350 μm), 36".3 (500 μm) |
| Typical sensitivity (5σ/1hr) | 5 mJy (70/110 μm bands), 10 mJy (160 μm band) | Will reach the confusion limit (see below) |
| Confusion limit (ideal case) | <0.1 mJy (70 μm), 0.27 mJy (100 μm), 0.92 mJy (160 μm) | 5.8mJy (250 μm), 6.3mJy (350 μm), 6.8mJy (500 μm) |
| Filters | 60-85 or 85-130 μm and 130-210 μm (simultaneous) | 250, 350 and 500 μm (simultaneous) |
One matrix of the PACS 160 micron channel was found to be unresponsive in data taken on OD-1375 (February 16th 2013). Despite considerable efforts by the PACS ICC, it could not be recovered, leading to the loss of 50% of the detector in this channel. This affected the spatial coverage offered by the channel, requiring mapping observations to be re-designed to allow them to be observed efficiently. The consequence was a small reduction in spatial coverage of 160 micron maps compared to 70 and 100 micron maps, plus a loss of approximately 30% in sensitivity in this channel from then until the end of the mission. Observations in Parallel Mode (Section 3.2.2) taken after the failure of the matrix show uneven coverage and severe striping in the 160 micron band due to the lack of the coverage from the second matrix.
Herschel offered a Parallel Mode for users who wished to carry out large-scale mapping programmes with a wide range of wavelength coverage.
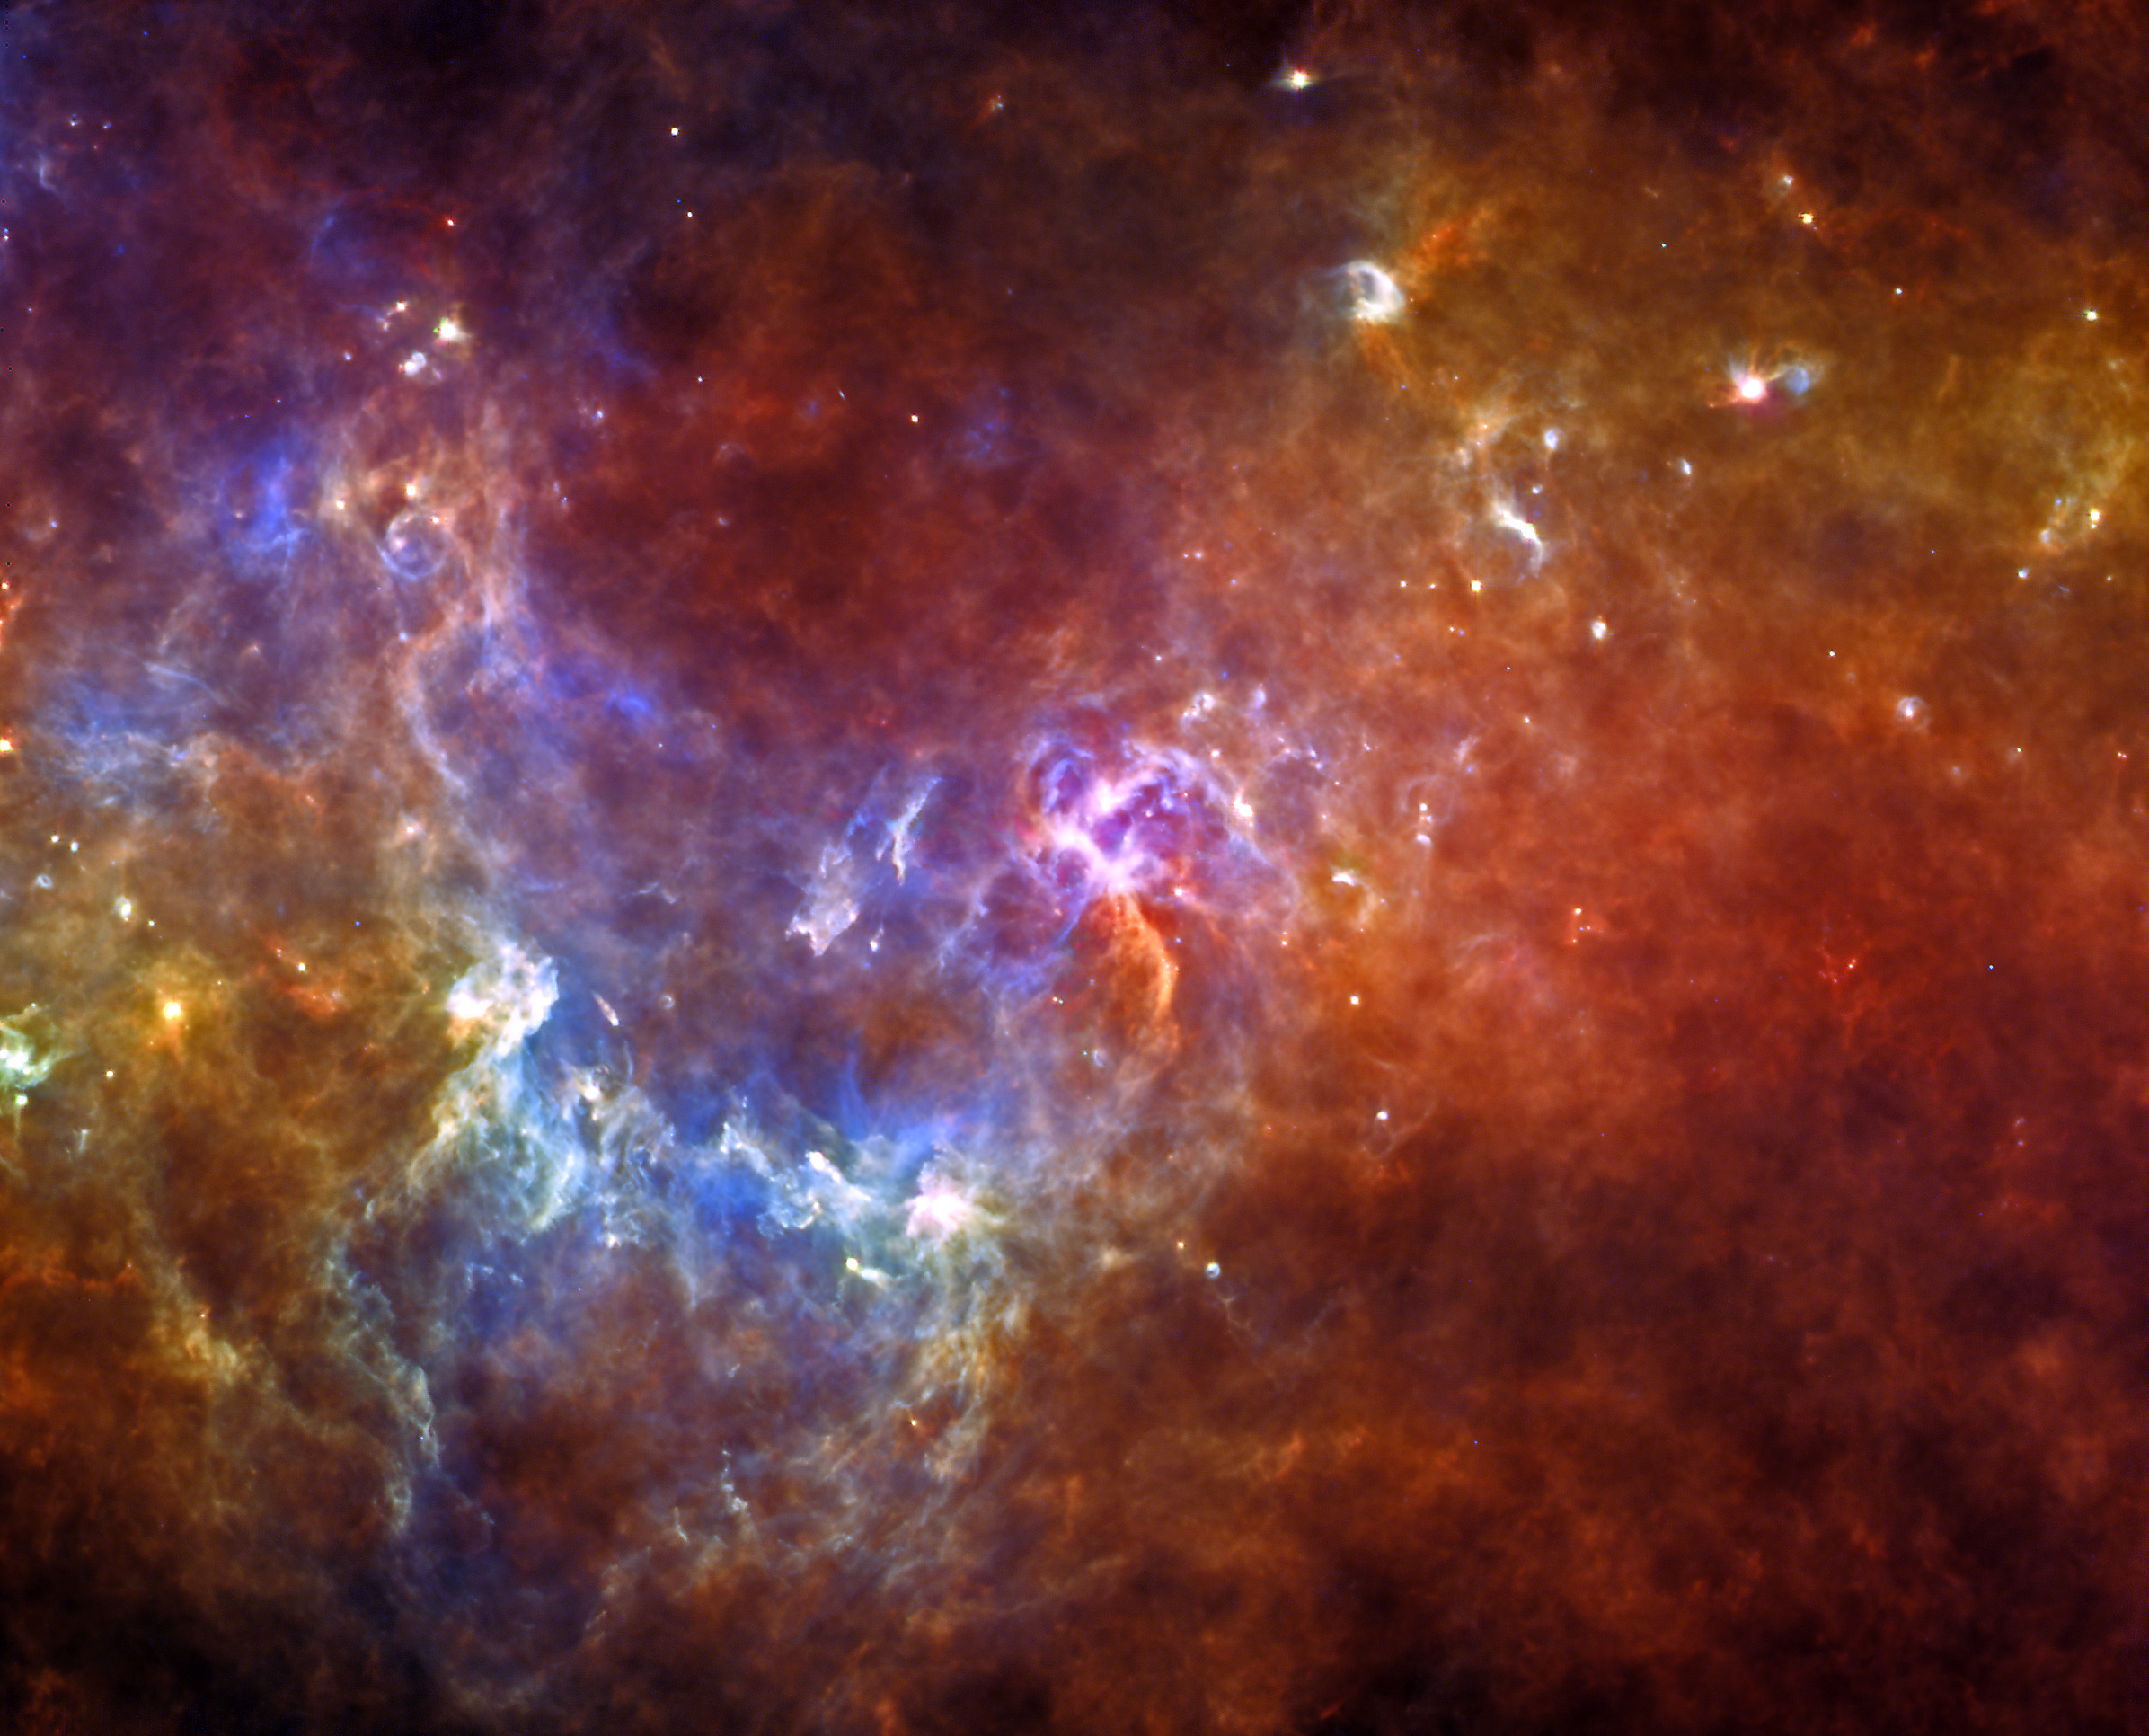
Figure 3.5. An example of use of the SPIRE PACS Parallel Mode. This is a Galactic Plane image from L=316 degrees, just north of Alpha Centauri, taken by the Hi-GAL project, as part of their 360 degree survey around the Galactic Plane. The use of bands from 70-500 microns in a single observation allows the different warm and cool dust emission to be identified, sampling a wide range of temperature and of physical conditions. The ability of Parallel Mode to cover large areas of sky rapidly was vital to the success of the Hi-GAL mapping.
Parallel Mode allowed observers to use both SPIRE and PACS simultaneously in a fast (60 arcsec/s) and nominal speed (20 arcsec/s) scanning mode, to cover very large areas of sky quickly in all three SPIRE bands and in two of the three PACS bands, to a modest sensitivity. This mode was intended to make ambitious, multi-band, large area mapping programmes more efficient than carrying them out individually with each instrument in turn (see Figure 3.5). In this mode SPIRE is the prime instrument and thus the driver in defining observations and PACS data, which is much shallower, particularly in the 70 micron band, should be treated more as a "bonus" to observers.
SPIRE and PACS pointed at different places on the sky separated by 21 arcminutes. This meant that this mode was extremely inefficient at mapping small areas of sky. Although a minimum area of 30x30 arcminutes for a Parallel Mode map was permitted by HSpot, Parallel Mode was not recommended for observing any area of sky smaller than one square degree and only became efficient for mapping for even larger areas than this. In contrast, observing with SPIRE alone was highly efficient for mapping large areas of sky quickly such that a number of Parallel Mode programmes moved to SPIRE-only mapping instead.
While the SPIRE integration gets to a depth which is fairly close to the confusion limit, the depth of exposure is relatively less for PACS and the flux limit attained in PACS is quite shallow and thus suitable only for bright sources and regions, hence Parallel Mode photometry should not be regarded as an adequate substitute for dedicated PACS scan maps in any area of the sky.
Although very large areas of sky could be mapped quickly at the high scan speed, the speed of scan was sufficiently high that some telescope movement occurred before detector readout was complete, giving rise to a small degree of PSF smearing in the scan direction.
Parallel Mode entailed having both PACS and SPIRE cool simultaneously and is thus was more demanding in terms of helium usage. As a rule of thumb, for each three parallel cooler re-cycles (6 days of Parallel Mode use) we reduced mission lifetime by one day with respect to using just PACS or SPIRE alone. For efficiency of helium consumption, using Parallel Mode was thus discouraged unless the increased wavelength coverage was genuinely required scientifically and made practical sense.