As with previous mission phases, there was a very gradual transition between SDP and Routine Operations. As each project received its SDP data, if no significant problems were revealed, the Principal Investigator (PI) was invited to have a release telecon with the Project Scientist and HSC staff to discuss the data and any problems or issues that had arisen. If no serious issues were identified, the PI was invited to release all, or part of the observations in his or her programme for scheduling, in which case, the observations would be made available to the HSC Mission Planners to be scheduled. The first routine observations were executed on 18 October 2009 -- a PACS scan map of the Lockman Hole for KPGT_dlutz_1. By December 2009, the immense majority of scheduled observations came from released routine programmes.
Over the course of the mission Herschel has produced hundreds, or thousands of spectacular images like the ones shown in Figure 1.16 and Figure 1.17.
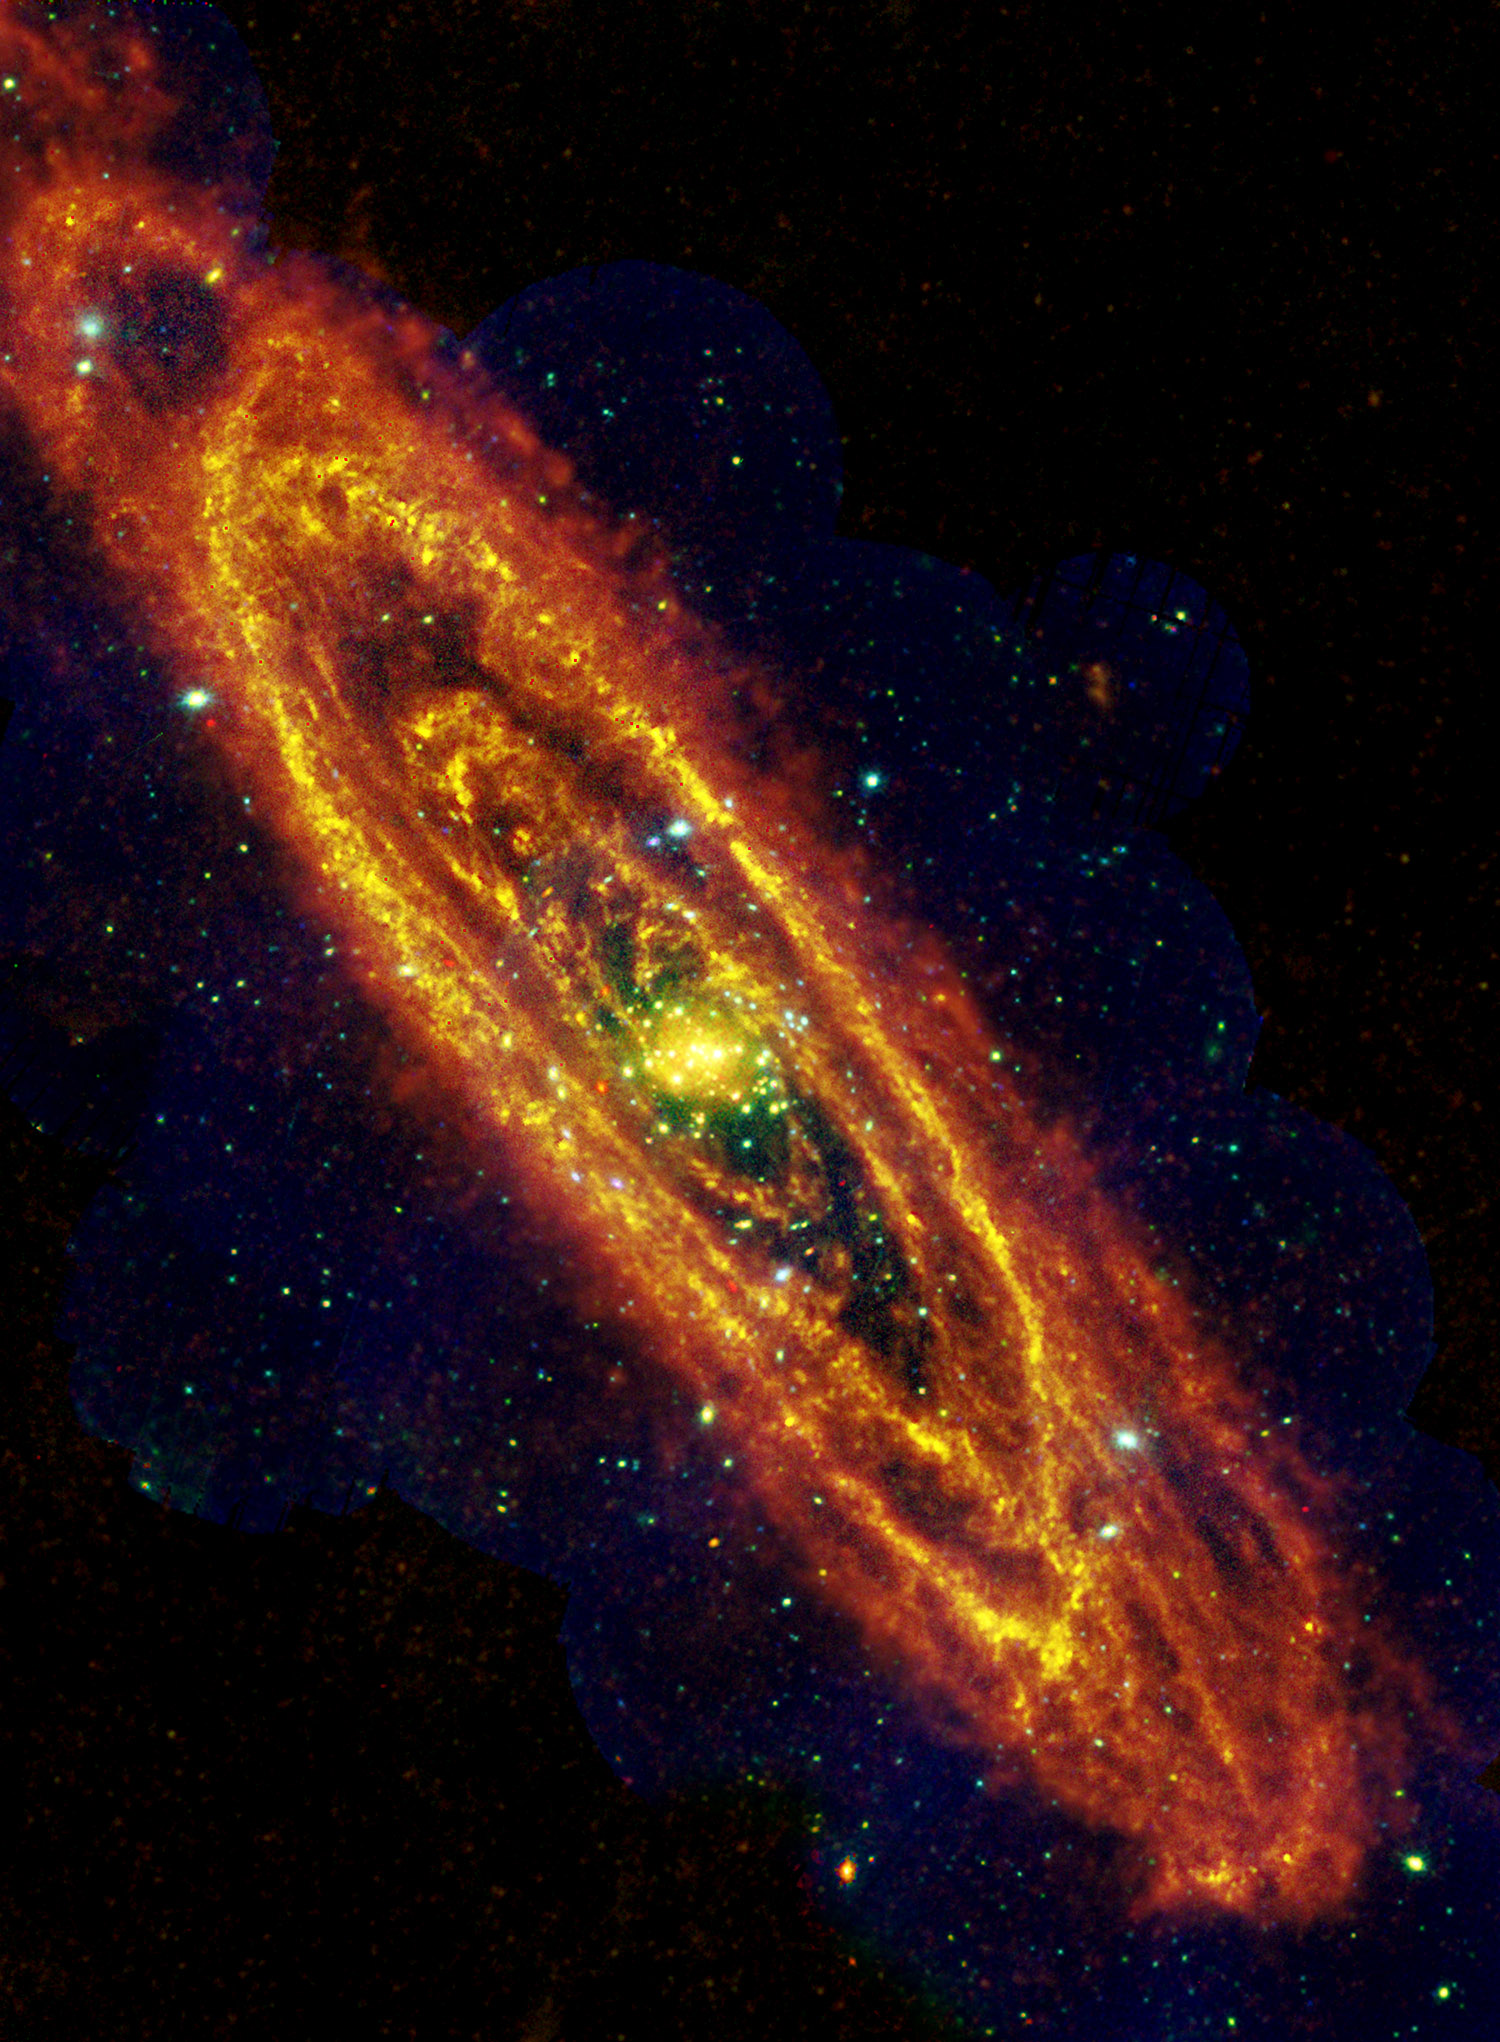
Figure 1.16. M31's once and future stars. A combined Herschel and XMM-Newton (x-ray) image of M31 showing dusty star-forming regions (Herschel) and the point-sources that represent highly evolved stars (XMM-Newton). The Herschel data were taken at 250 microns with SPIRE between 17 and 21 December 2010. In the XMM-Newton RGB image, red sources are those that have soft x-ray spectra, dominated by low-energy x-ray emission; these are normally low-mass x-ray binaries, while the blue sources are sources with hard x-ray spectra, dominated by high-energy emission, which are high-mass compact binaries with a neutron star, or black hole secondary. This image contains what is effectively a snapshot of the star formation history of M31 and its two satellite galaxies, M32 (superimposed on the spiral arm below the nucleus of M31) and M110 (very faintly visible in the Herschel image to the top right). Whereas M110 is essentially a dying galaxy, with only a tiny residual of star formation and no massive stars at all, M31 is very much alive and boiling with star formation activity in the dark rifts between its spiral arms.
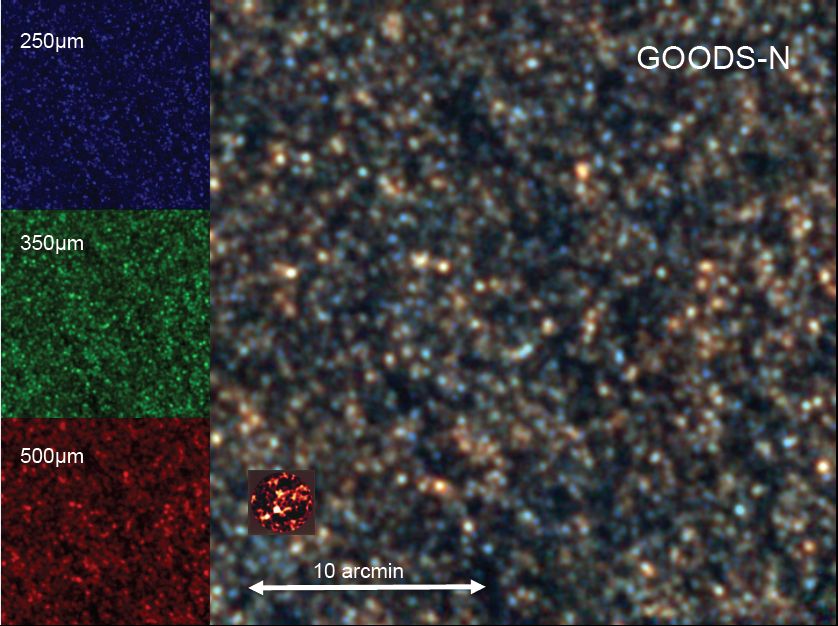
Figure 1.17. Galaxies spread like grains of sand on a beach. Every source in this GOODS-N field, which is about the size of the Full Moon, is a distant galaxy. The insert to the left shows the indivdual frames in each of the SPIRE bands while the main image combines them as an RGB. The colour of the galaxy gives an indication of its red shift and, hence, distance: the reddest galaxies are the most distant and may be as much as 12 000 million light years away; blue objects are relatively nearby and may be as close as 6000 million light years. In the inset to the lower left we see, to the same scale, the very best sub-millimetre image of this field that had ever been obtained from the ground at this time. This inset image is the result of 20 nights of exposure from Mauna Kea with the James Clerk Maxwell Telescope + SCUBA, in exceptional observing conditions; this image is to the same scale as the Herschel image - the full SCUBA field is 2.5 arcminutes diameter - and shows exactly 5 sources compared to Herschel's 15000 sources in the full 4x4 degree field of this region, detected in just 16 hours of exposure.
The pre-launch goal was for Herschel to carry out routine science operations for a minimum of 3 years, with an aim to complete 20 000 hours of science observations. To maximise the science return this time was carefully divided up into segments. During the first two years of the mission, Guaranteed Time and "Key Project" observing programmes received absolute priority. Key Projects were performed early in the mission to permit follow-up and to give the Guaranteed Time holders the opportunity to obtain real data to work with, in preparation for supplying community support to the open time observers with the benefit of a thorough knowledge of the entire observing chain from proposal submission to access and reduction of data. Almost all Key Programme observations were completed by May 2011, at which point OT1 observing programmes started to be heavily scheduled, although some OT1 observations had been scheduled as early as December 2010 where they helped to improve observing efficiency by filling inconvenient gaps in the telescope schedule. A similar pattern, shifted by one year, applied to OT2 observations. All Priority 1 observations in the database, save for cases of force majeur and a few time-constrained observations were completed by the end of 2012. Over the last six months of the mission, the schedule was increasingly dominated by Priority 2 observations, as the pool of available Priority 1 was depleted.
All observers could track the state of their proposals from the (password protected) proposal handling pages of the HSC Web page and were notified when the resulting data had been passed through the initial Quality Control process; this would take a minimum of 2-3 weeks to complete as it involved an individual inspection by eye of all images and spectra by an expert at HSC. Even so, data was available for retrieval from the HSC usually within 48 hours of the observations being executed.
Observers could also check both what observations were scheduled for observation and which had been delivered to MOC, but not yet executed:
http://herschel.esac.esa.int/observing/ScheduleReport.html
and the log of executed observations:
http://herschel.esac.esa.int/observing/LogReport.html
from the HSC, which constitutes the formal Observing Log of executed science observations (engineering and calibration observation were not recorded in either the observing schedule, or in the Observing Log).
Observations declared to be "Failed" due an anomaly in execution were automatically cloned manually by the Community Support Team and released for re-scheduling by HSC, without the need for intervention by the affected astronomer, who was informed as soon as the failed observations were cloned and re-released for scheduling. Frequently, this process was completed before the astronomer was even aware that there had been a problem with the original execution of the observations.
There was considerable uncertainty as to when boil off would happen. Much of this uncertainty was due to a lack of detailed knowledge of exactly how much helium Herschel carried at launch, because the boil-off after fairing closure was essentially unquantifiable. An attempt to estimate the lifetime was made by taking three Direct Liquid Content Measurements (DLCMs) of the cryostat in space. These used a small heat pulse into the cryostat to measure the temperature rise and, hence the mass of helium with a nominal uncertainty of approximately 5%. However, there was a significant disagreement between the three derived estimates leading to considerable uncertainty in the lifetime that was obtained by extrapolating the least squares fit between the three measures to zero (knowledge acquired a posteriori suggests that the second DLCM gave a value that was rather too low).
This uncertainty was significantly reduced by using data from cooler re-cyclings, with the temperature rise as the cooler was cycled giving a direct estimate of the mass of remaining helium (effectively, each cooler re-cycling was a mini-DLCM). The best estimate in late 2012 placed the most likely date for helium exhaustion around mid-February 2013, but with an uncertainty of several weeks. Further estimates, with data at increasingly low fill levels, extended the likely lifetime to late March and then, finally, into early April, at which point it became obvious that there was a small, systematic offset in the values derived by the models, although the fact that the temperature rise during re-cyclings was much larger than even six months previously and increasing rapidly with each successive re-cycling, made it evident that helium exhaustion was very close.
There was some concern that, in the last few days or weeks of the mission, the behaviour of the instrument coolers would change after the helium level had dropped below a certain point and that, possibly, the cooler hold time would suffer a significant reduction. This was uncertain at the time, as we did not know exactly what the helium behaviour would be at very low levels. However, the cooler behaviour was found to be close to nominal until the end of the cold mission. The penultimate cooler re-cycling, which was executed on OD-1440 (April 22nd), was somewhat anomalous in that the temperature during the re-cycling did not reach the expected level but, in the end, the hold time was only fractionally reduced from normal. In contrast, the final cooler re-cycle to be successfully executed during the mission, which was carried out on OD-1443 (April 25th), was completely nominal in all respects (helium boil-off occurred around two hours before the next scheduled cooler re-cycle -- a SPIRE re-cycle -- was due to start).
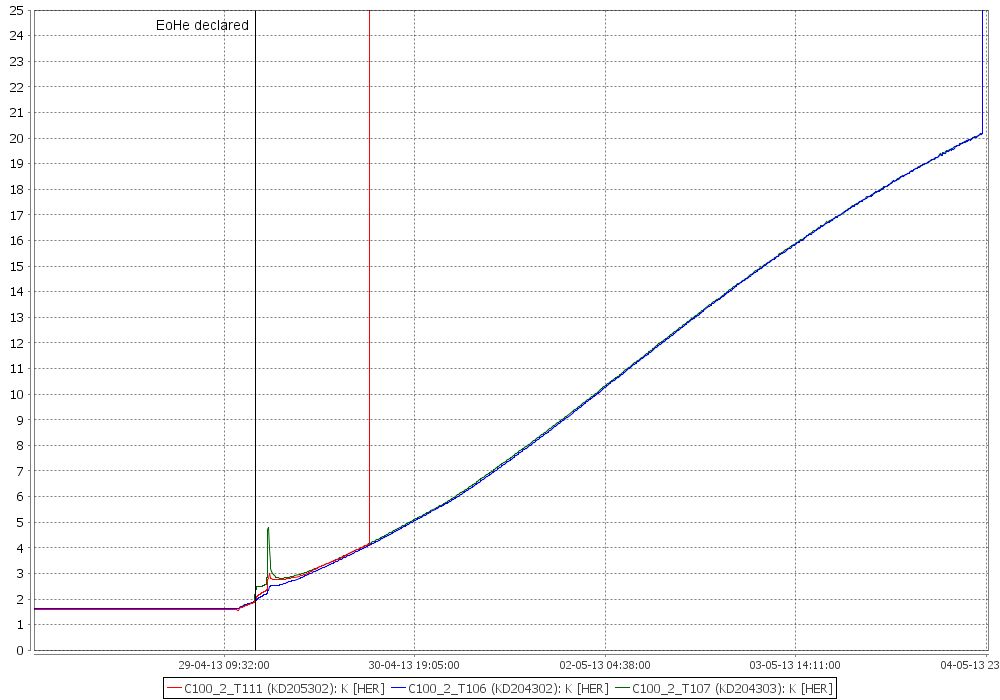
Figure 1.18. Cryostat temperatures from April 28th to May 4th 2013. The graph is initially stable at 1.7K before starting to rise around 12:30UT on April 29th, marking the evaporation of the last drop of helium. The solid black line marks the point at which an internal temperature of 2.0K was reached, marking the formal criterion for declaring End of helium. The plot shows the slow rise of the cryostat temperature after End of Helium (EoH) was declared. Temperature curves are shown for the T111 (red curve), T106 (navy blue curve) and T107 (green curve) sensors, which were in different positions inside the cryostat. As each sensor went out of limits it shoots vertically off the scale. Approximately five days after boil-off the temperature reached 20K and the T106 and T107 sensors went out of limits simultaneously (Graphic courtesy: MOC).
At Acquisition of Signal (14:15UT) on April 29th 2013 (the start of OD-1447) the temperature inside the cryostat was noticed to be anomalously high and trending upwards. This trend had started at 12:30UT approximately and marked the point at which the last drop of helium evaporated. Formal End of Helium (EoH) was declared at 15:20:01UT when the temperature within the cryostat passed 2K. Figure 1.18 shows the behaviour of the cryostat temperature as measured by three of the internal sensors, with the solid vertical black line marking the point at which the end of helium criterion was met; the other vertical lines mark the point at which each sensor went out of limits and subsequently registered as off scale.
The final, successfully executed science observation of the mission was completed at 07:40:57UT on April 29th. This was a HIFI Band 4b observation of the star OH 32.8-0.3 taken for DDT_kjusttan_3 and shows a strong detection of the OH line (Figure 1.19). As there was a Spacecraft Operations (SOPS) window for a manoeuvre scheduled after this observation, followed by a cooler re-cycle, no science observations were affected by the rising temperatures before EoH was declared and the instrument sub-schedule was disabled, stopping the telescope from continuing to attempt to execute observations.
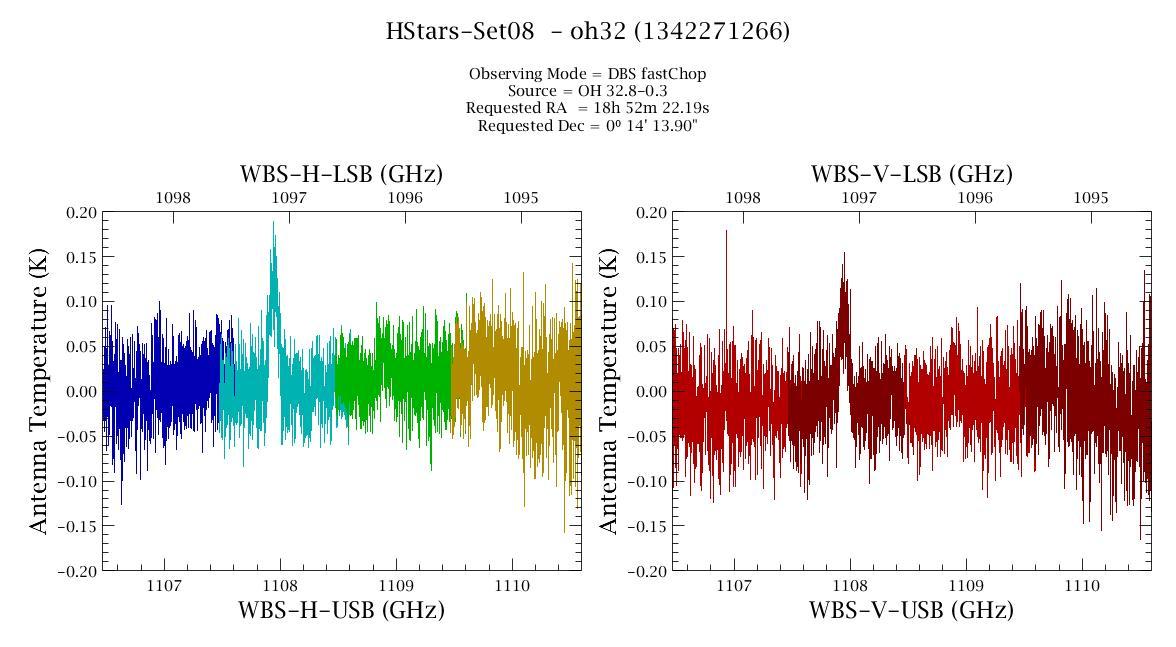
Figure 1.19. The final science observation executed before End of Helium. There is a strong detection of the OH line at 1107.9GHz (270.6 microns) in the HIFI Band 4b spectrum of the star OH 32.8-0.3. The two panels show the horizontal (left) and vertical (right) polarisation component of the spectrum.
Table 1.1 gives a summary of the key dates in the Herschel mission. For the reasons explained above, it is extremely difficult to put hard dates for the beginning and end of some mission phases as the tended to have a smooth transition, for example, as in the case of the transition from Performance Verification to Science Demonstration to Routine Operations.
Table 1.1. A summary of Herschel mission key dates. Only approximate dates can be assigned to many of the different mission phases as there is inevitably a progressive transition between mission phases rather than a sharp one; on some occasions there were activities from three different mission phases progressing simultaneously and, in some cases, the start and end of a phase is a matter of definition and different dates could be given to the ones that appear here. In particular, HIFI recovery activities meant that CoP and PV days were scheduled months after the nominal end of these phases. Similarly, as reflected by this table, occasional PV days were being scheduled for PACS and SPIRE long after even routine observations had started.
| Mission phase | Approximate Start | Approximate End |
| Launch | L=14 May 2009 | |
| Early Orbit Phase | L | 24 May 2009 (L+10 days) |
| Commissioning Phase | L | July 19th (L+66 days) |
| Performance Verification Phase | 17 July 2009 (L+64 days) | 25 November 2009 (L+195 days) |
| Science Demonstration Phase | 11 September 2009 (L+120 days) | 30 April 2010 (L+352 days) |
| Herschel Routine Phase | 18 October 2009 (L+157 days) | L+47.5 months; Boil-off = B |
| Run-down phase (3 months) | B (April 29th 2013) | B+3 months (end July 2013) |
| Mission consolidation phase (6 months) | B+3 months (August 2013) | B+9 months (February 2014) |
| Active archive phase (48 months) | B+9 months (February 2014) | B+51 months (July 2017) |
| Archive consolidation phase (6 months) | B+51 months (July 2017) | B+56 months (End of Herschel mission), December 31st 2017 |
| Historical archive phase (indefinite) | B+56 months (January 1st 2018) | (TBD) End of all Herschel activity |
The Herschel post-operations phase consists of the rundown monitoring phase (starting at the moment of helium boil-off), mission consolidation phase, active archive phase, and the archive consolidation phase (at which point the transfer to the subsequent historical archive phase takes place), which is the final formal phase of the mission. Herschel is funded for almost 5 years of post-operations.
Once boil off had occurred, Herschel's instruments were no longer able to operate. As all the instruments needed temperatures below 10K to operate there was no possibility of a warm phase, as the temperature inside the cryostat was expected to warm within a few hours to 50K (in fact, the temperature took around four days to reach 20K). There was considerable discussion about what to do with Herschel finally post-helium. A key feature of the post-helium plan was to ensure safe disposal of the spacecraft
MOC continued to operate Herschel for seven weeks after boil off had occurred. This time was used for routine spacecraft housekeeping operations and a long series of technology tests involving all three instruments and various spacecraft sub-systems such as the star-tracker. Similarly, the radiation monitors continued to function as a space weather station until end of the mission (see Figure 4.7). A proposal that Herschel be crashed deliberately into the Moon was rejected and it was finally decided to place Herschel into a non-return solar orbit using a series of disposal manoeuvres.
The first stage of disposal was a short burn to leave the stable envelope around L2. This was done in advance of End of Helium. A burn of 10.51 m/s was made on March 15th 2013, at the end of OD-1401. This ensured that Herschel would start to drift away from the Earth (Figure 1.20)
The second stage of disposal was the main burn. This was made on May 13th 2013 (OD-1461), starting at 18:20:35UT and involved firing the thrusters for 7h46m to give a Delta-V of 113.7m/s. This was the longest burn ever made with thrusters of the type installed on Herschel (the EADS CHT20). This burn raised the aphelion of Herschel.
The length of the burn was determined by the need to ensure that it ended before the hydrazine in the thrusters was exhausted to ensure a controlled end of burn; this meant stopping the burn when it had consumed the smallest amount of hydrazine that it was believed could still be in the tanks.
The final stage of disposal was carried out on June 17th, at the start of OD-1497. With all tests complete, the satellite was prepared for final de-activation. The fuel was drained with a final manoeuvre to empty the tanks completely, a process that took approximately two hours to complete, in line with the best estimate of the amount of fuel remaining before the drain manoeuvre. This gave a final impulse of 31m/s. As the fuel was exhausted, the telemetry in the Operations Room at MOC showed that the pressure in the reaction chamber was dropping non-linearly (Figure 1.21). Once the fuel level became critical, the burn became unstable as different thrusters continued to fire weakly while others flamed out, at which point the burn was terminated manually and the spacecraft was stabilised with the reaction wheels, ready for the passivation. This consisted of sending a command to switch off the spacecraft transponder, so that it would no longer try to establish daily contact with Earth (Figure 1.22).
Once the command was sent, it took 6s to reach Herschel and a further 6s for the response of the transponder to reach Earth. It then took several seconds for the signal to drop to zero, indicating that Herschel was finally silent (Figure 1.23). With the transponder silent, the telemetry on the screens in the Main Control Room flatlined (Figure 1.24).
Initial assessment of the orbit after the final drain manoeuvre showed that Herschel was in an orbit completely exterior to the Earth's, with perihelion at 1.036AU and aphelion at 1.064AU. This will give a close encounter with Earth approximately every 14 years, with the next encounter in October 2027 at a distance of 0.050AU, equivalent to 7.5 million kilometres or 19.5 Lunar Distances, at which time the satellite will be magnitude 23 approximately and is likely to picked-up in routine monitoring for Near Earth Asteroids.
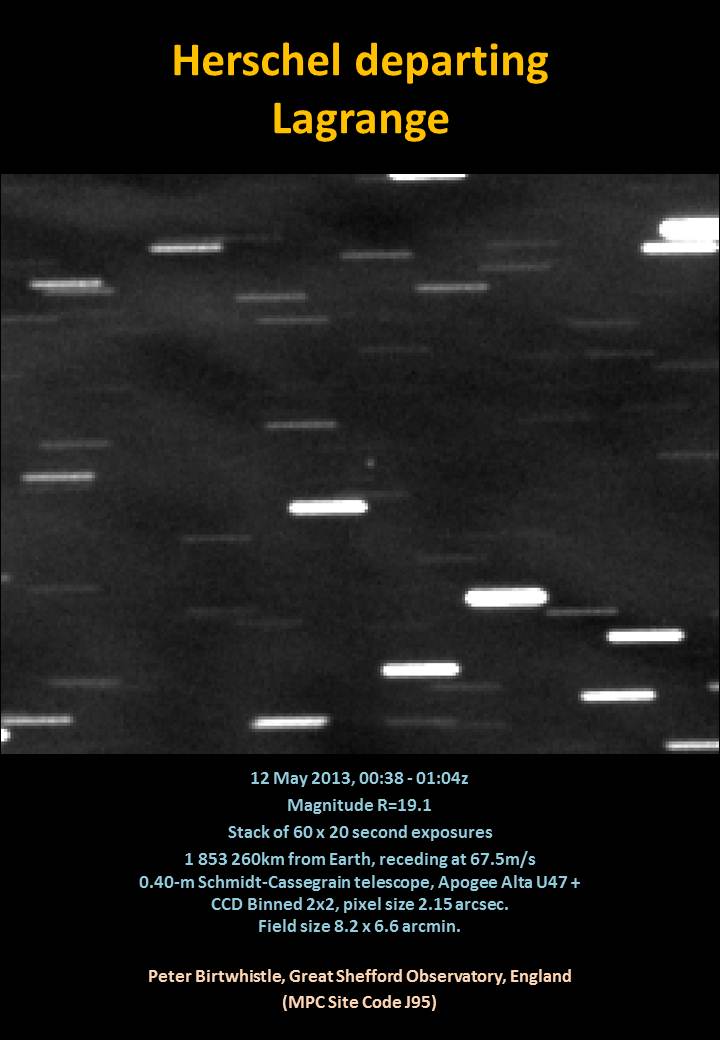
Figure 1.20. Herschel departing Lagrange, observed from Earth 17h before the main burn started. This image was taken on May 12th 2013, by British amateur astronomer Peter Birtwhistle, from Great Shefford Observatory (Minor Planet Center site code J93), approximately 90km west of London, using a 40cm reflector. The image is the sum of 60 individual exposures of 20s each, stacked on the motion of Herschel. The field of view is 6.6 arcminutes wide by 8.2 arcminutes high.
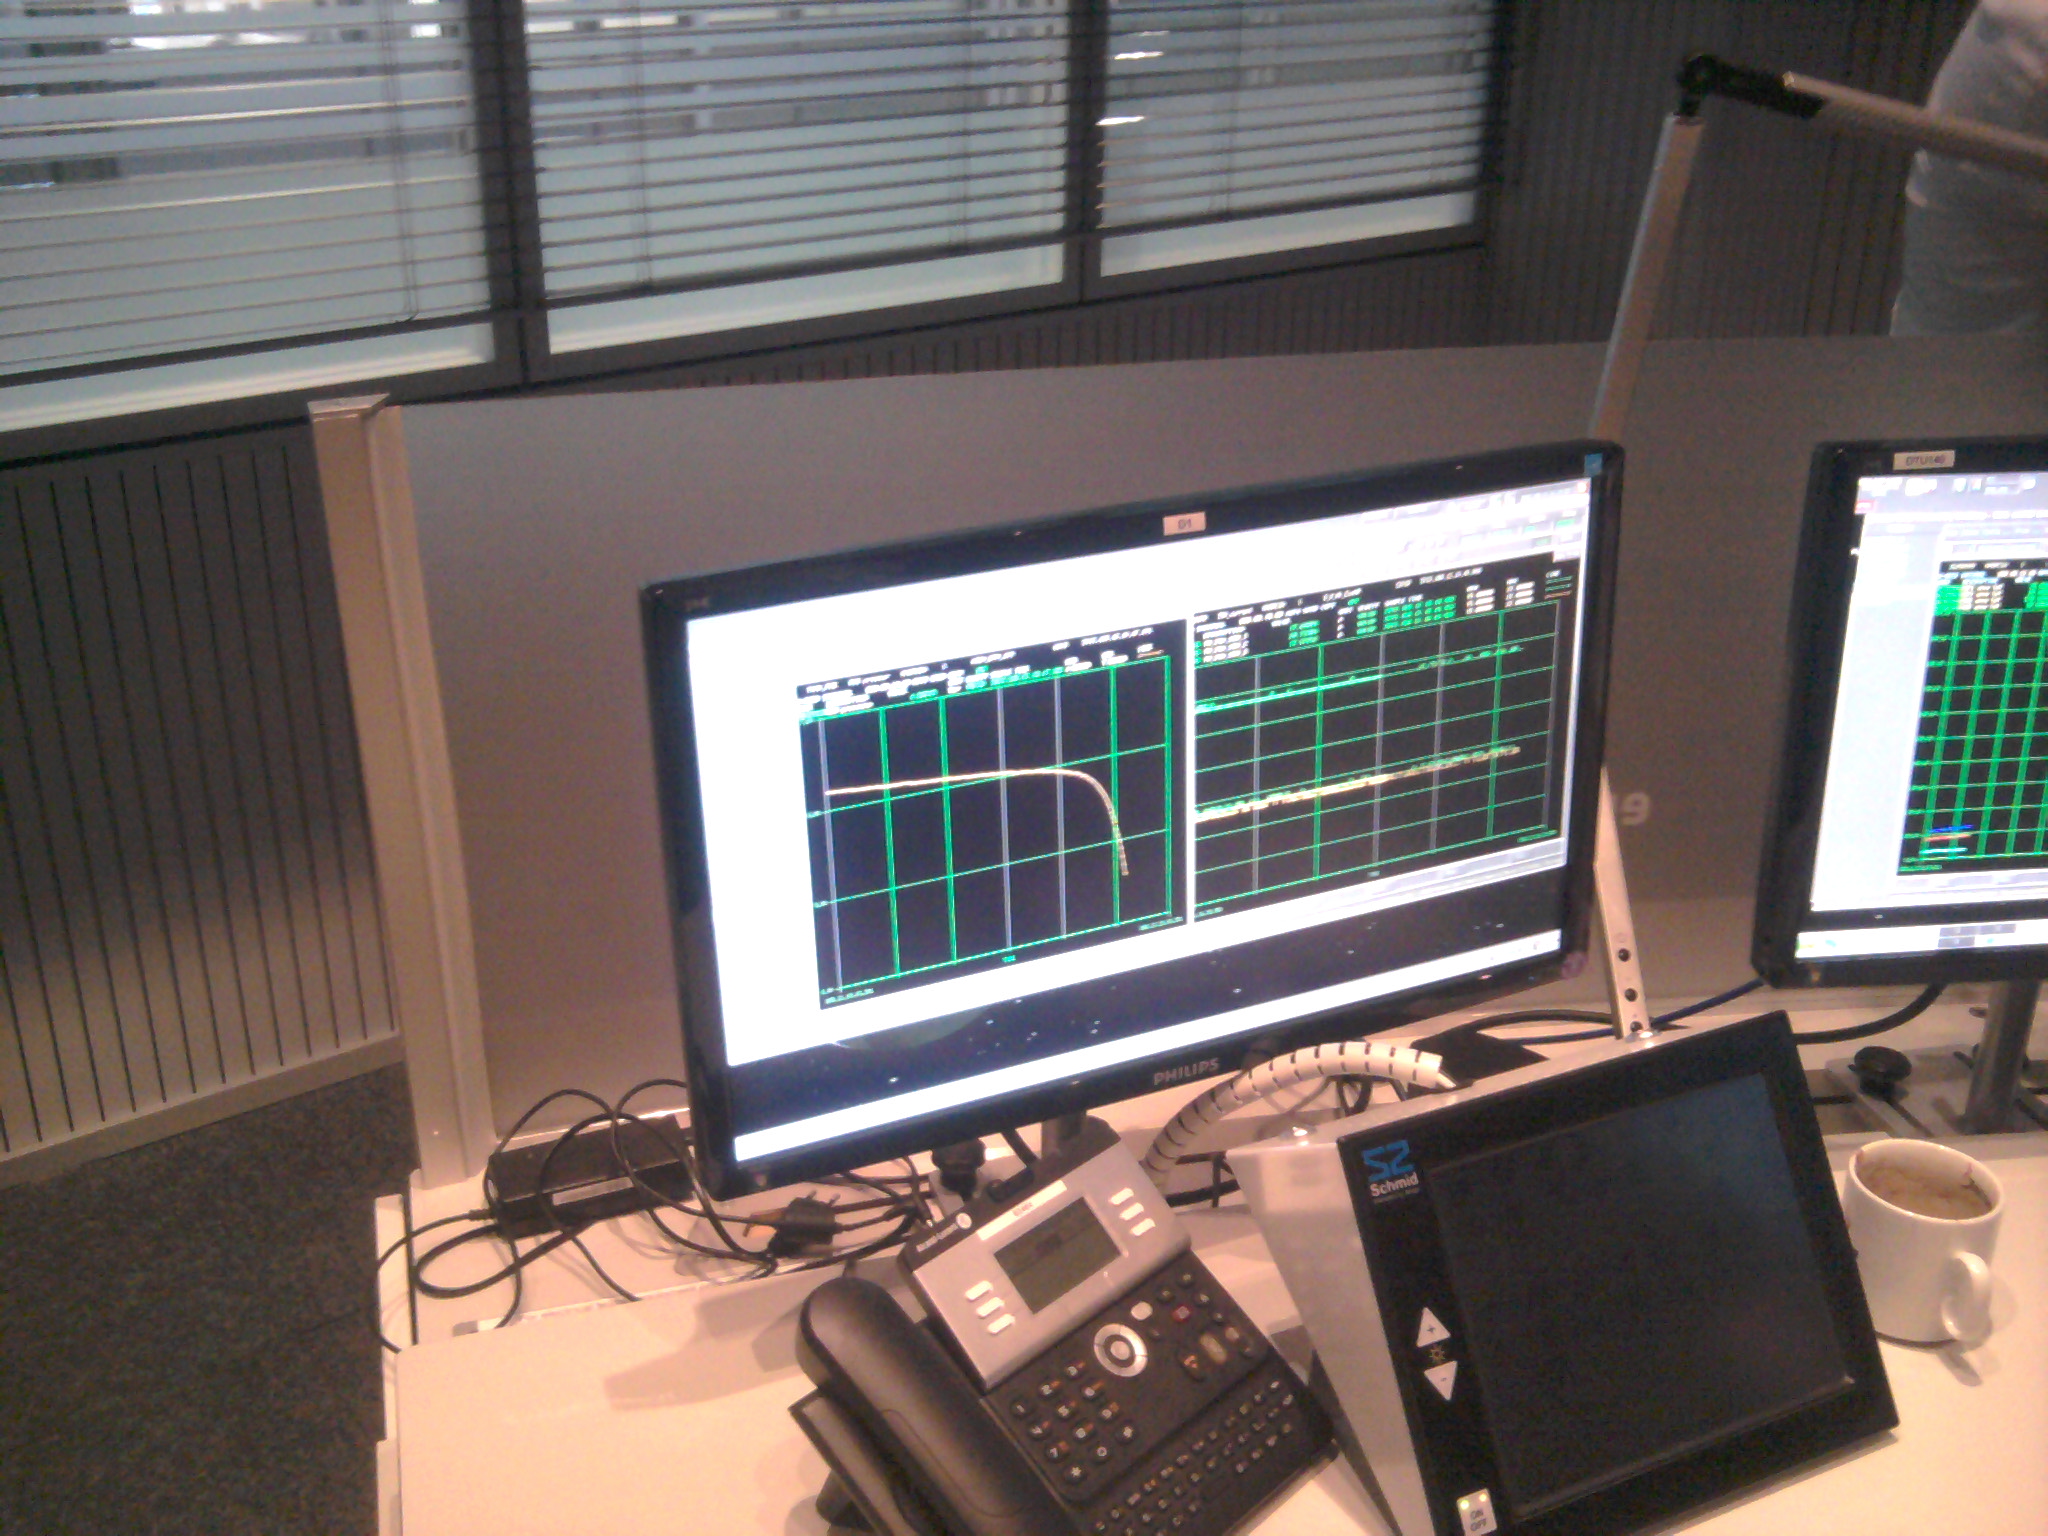
Figure 1.21. Screen in the Main Control Room at MOC showing (left hand plot) the rapid drop in pressure in the reaction chamber of the thrusters as the fuel was exhausted. This drop in pressure indicated that the fuel was close to exhaustion, allowing the final commands to cut the burn, stabilise the spacecraft and to passify to be carried out in a controlled manner.
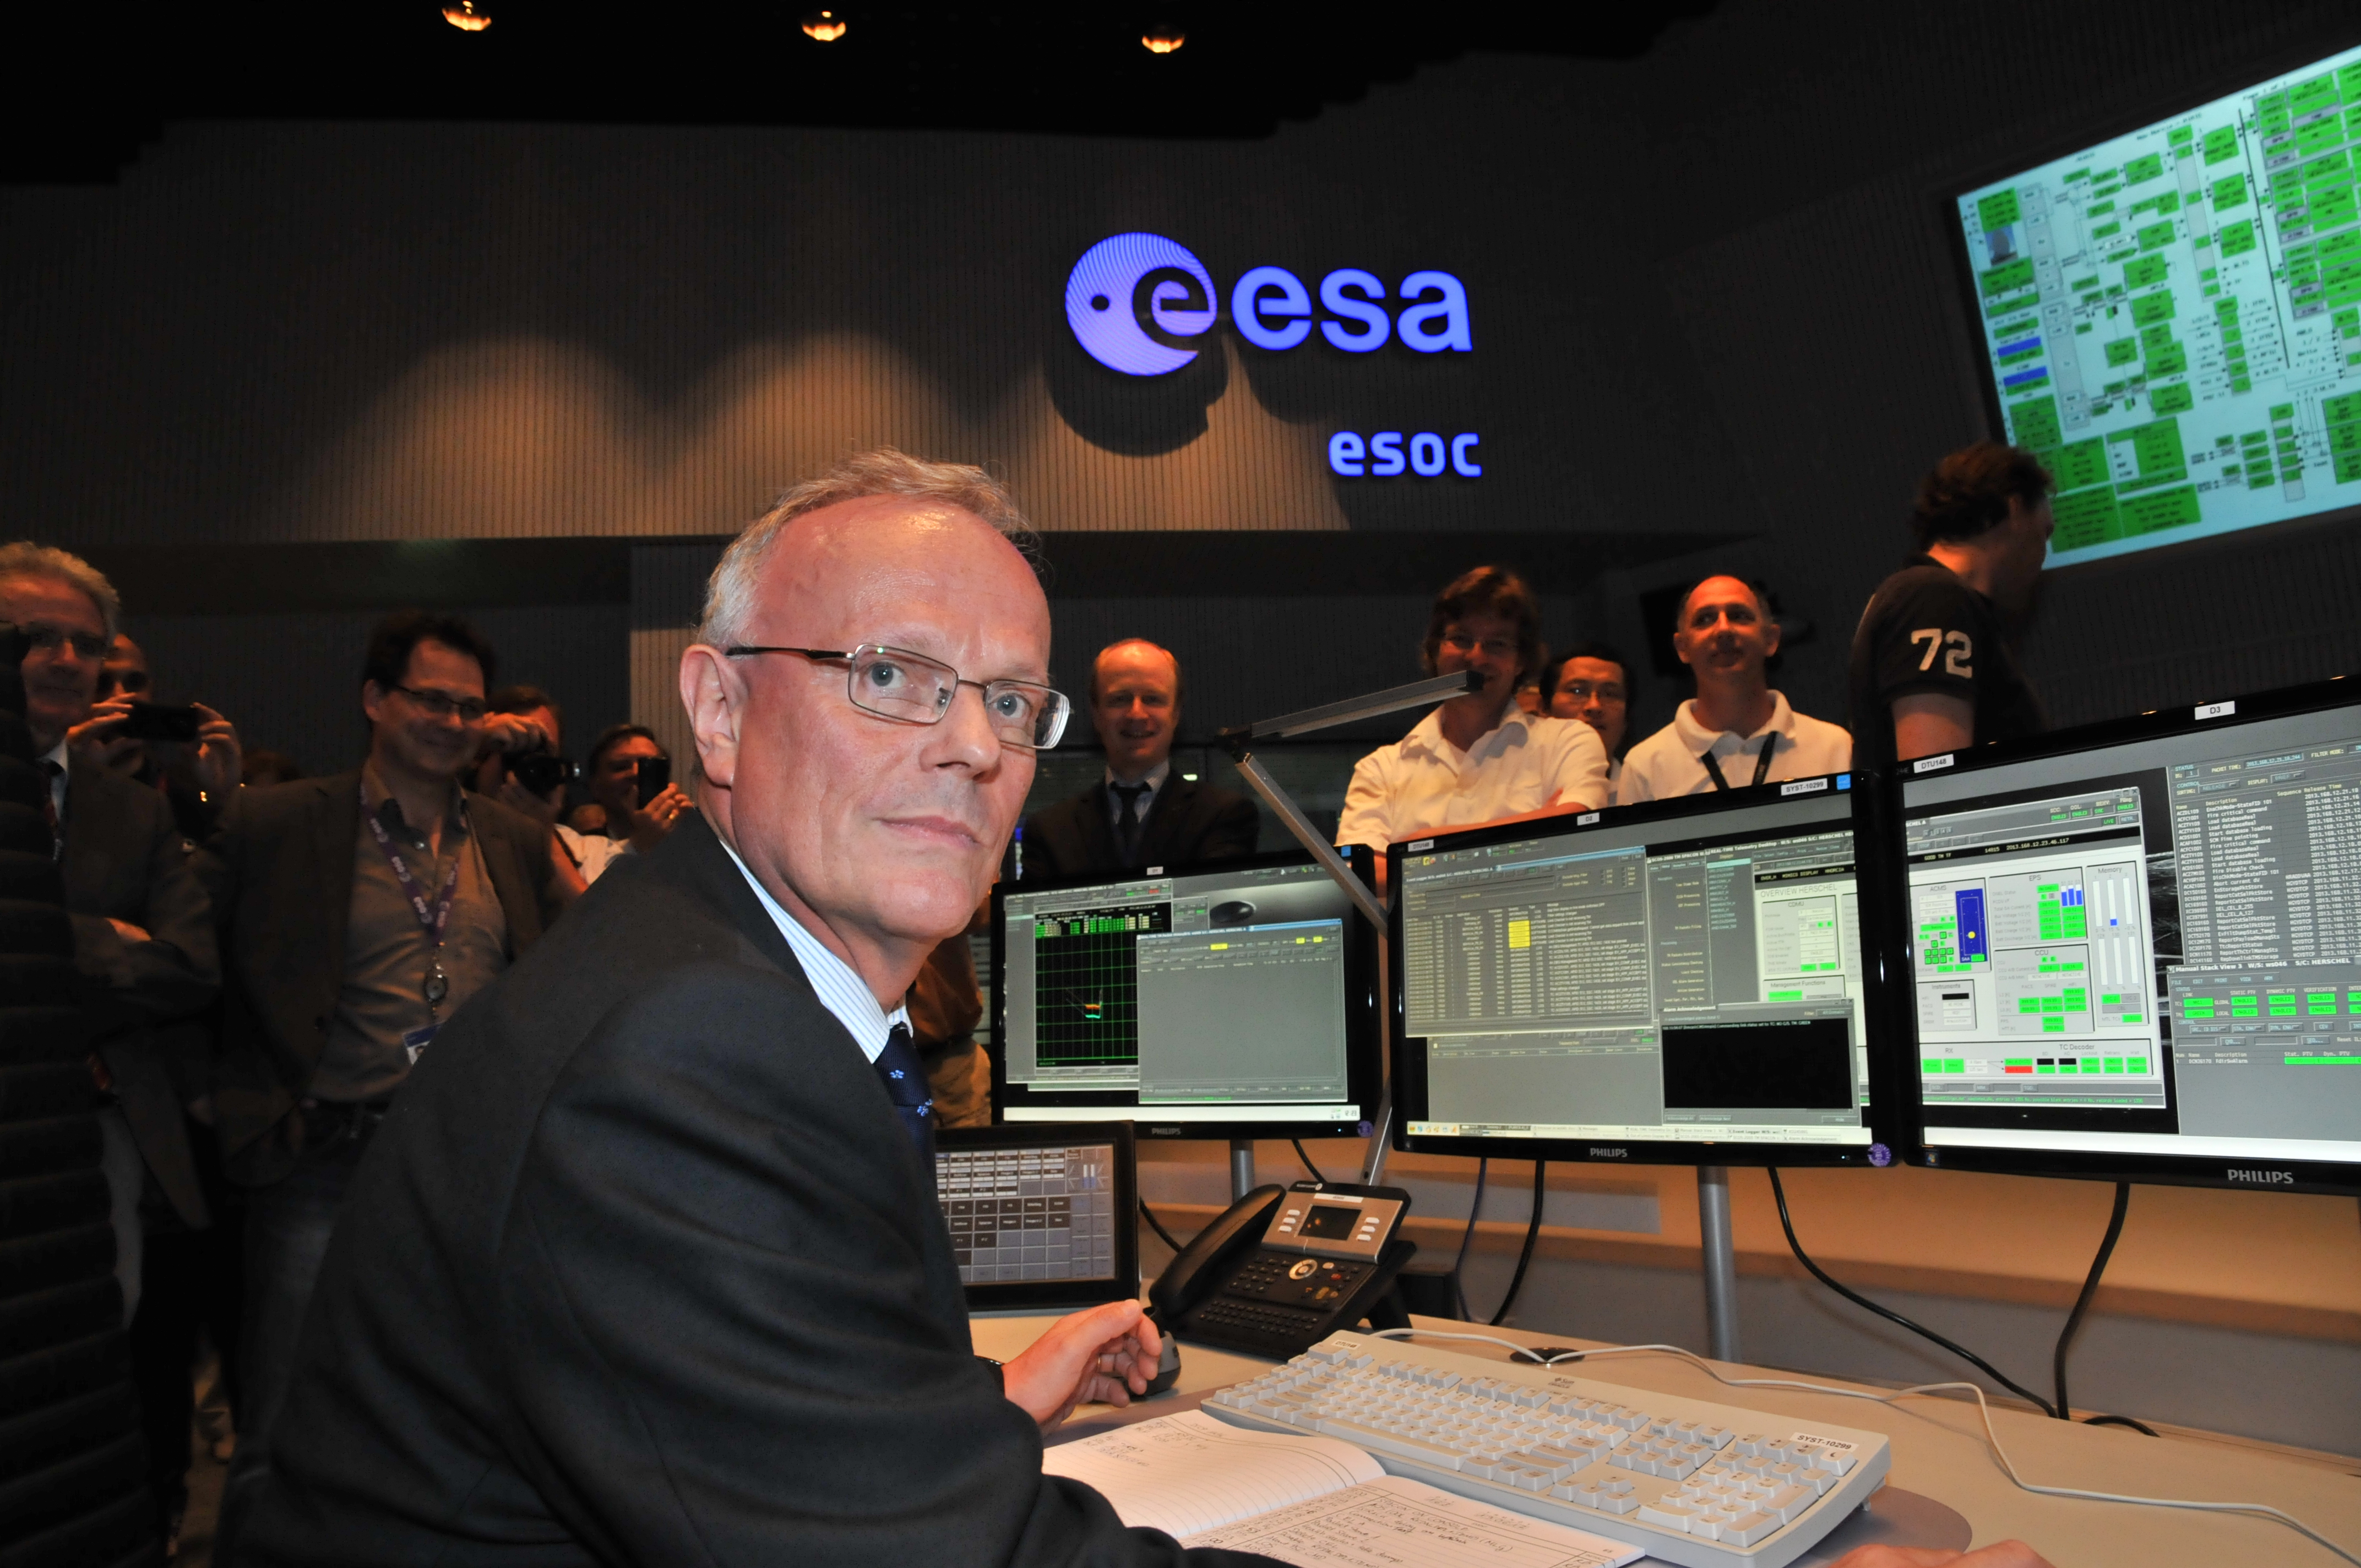
Figure 1.22. Martin Kessler, Head of ESA's Science Operations Department, sends the final command to Herschel at 12:25 GMT (14:25 CEST), 17th June 2013, from the Main Control Room at ESOC, Darmstadt.
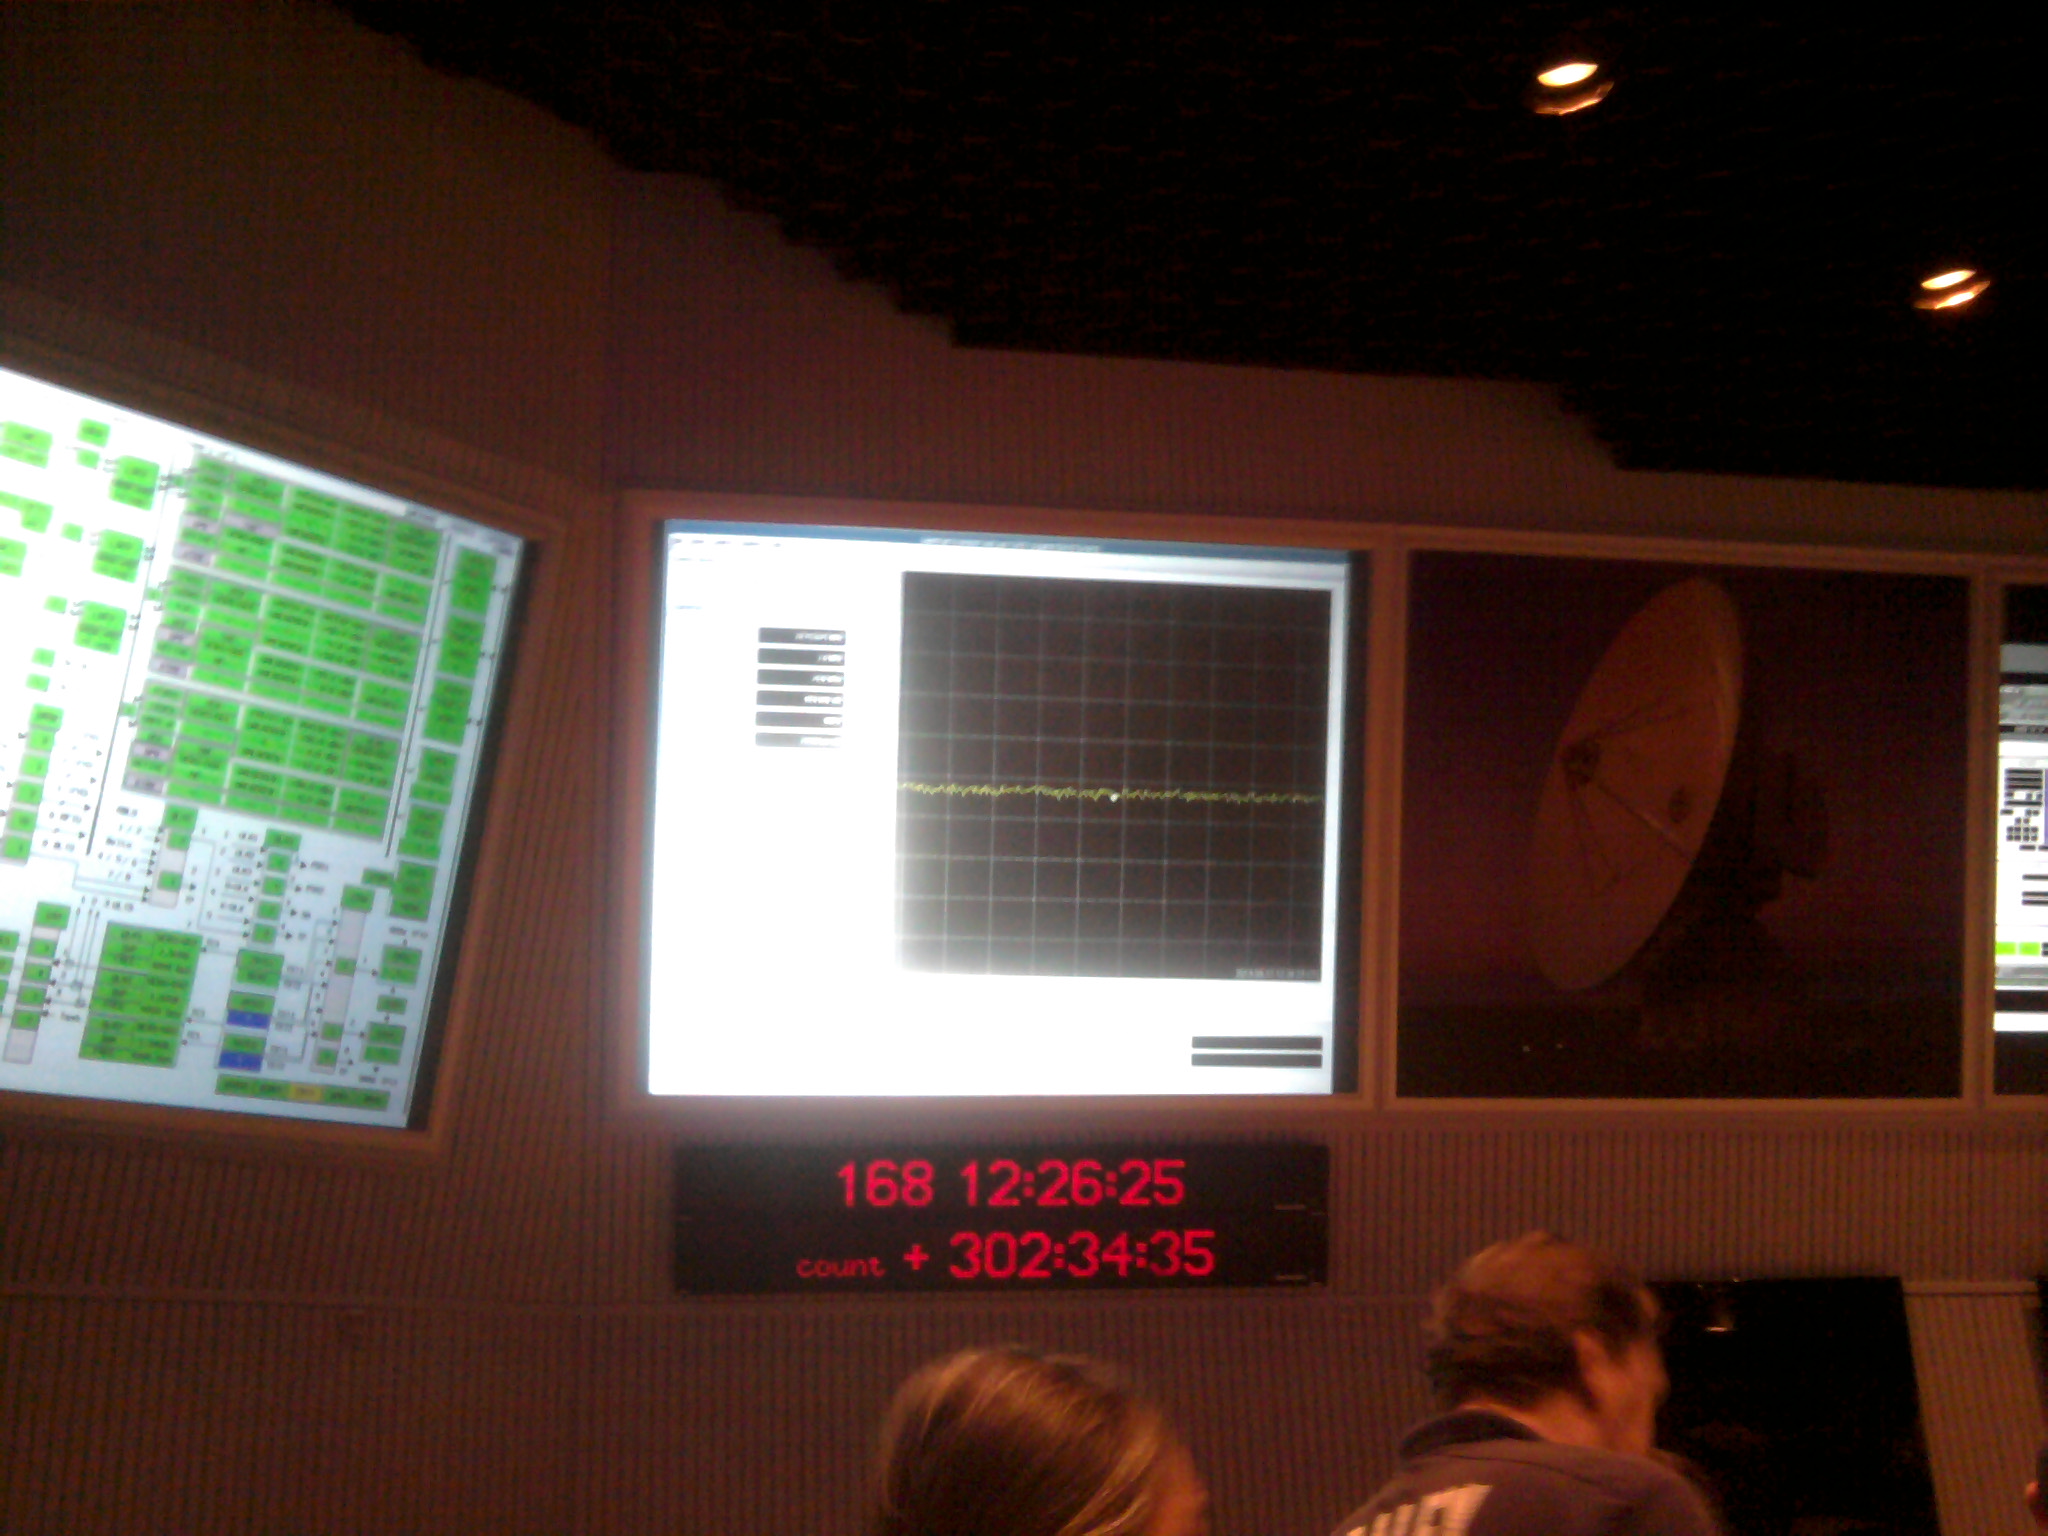
Figure 1.23. The screen in the Main Control Room at MOC showing the output from the frequency analyser. This would normally show a strong signal at the frequency of the Herschel transponder. The flat line shows that the signal from the Herschel transponder had dropped to zero after switch-off. The point at which the transponder signal dropped to zero marked the end of the Herschel mission.
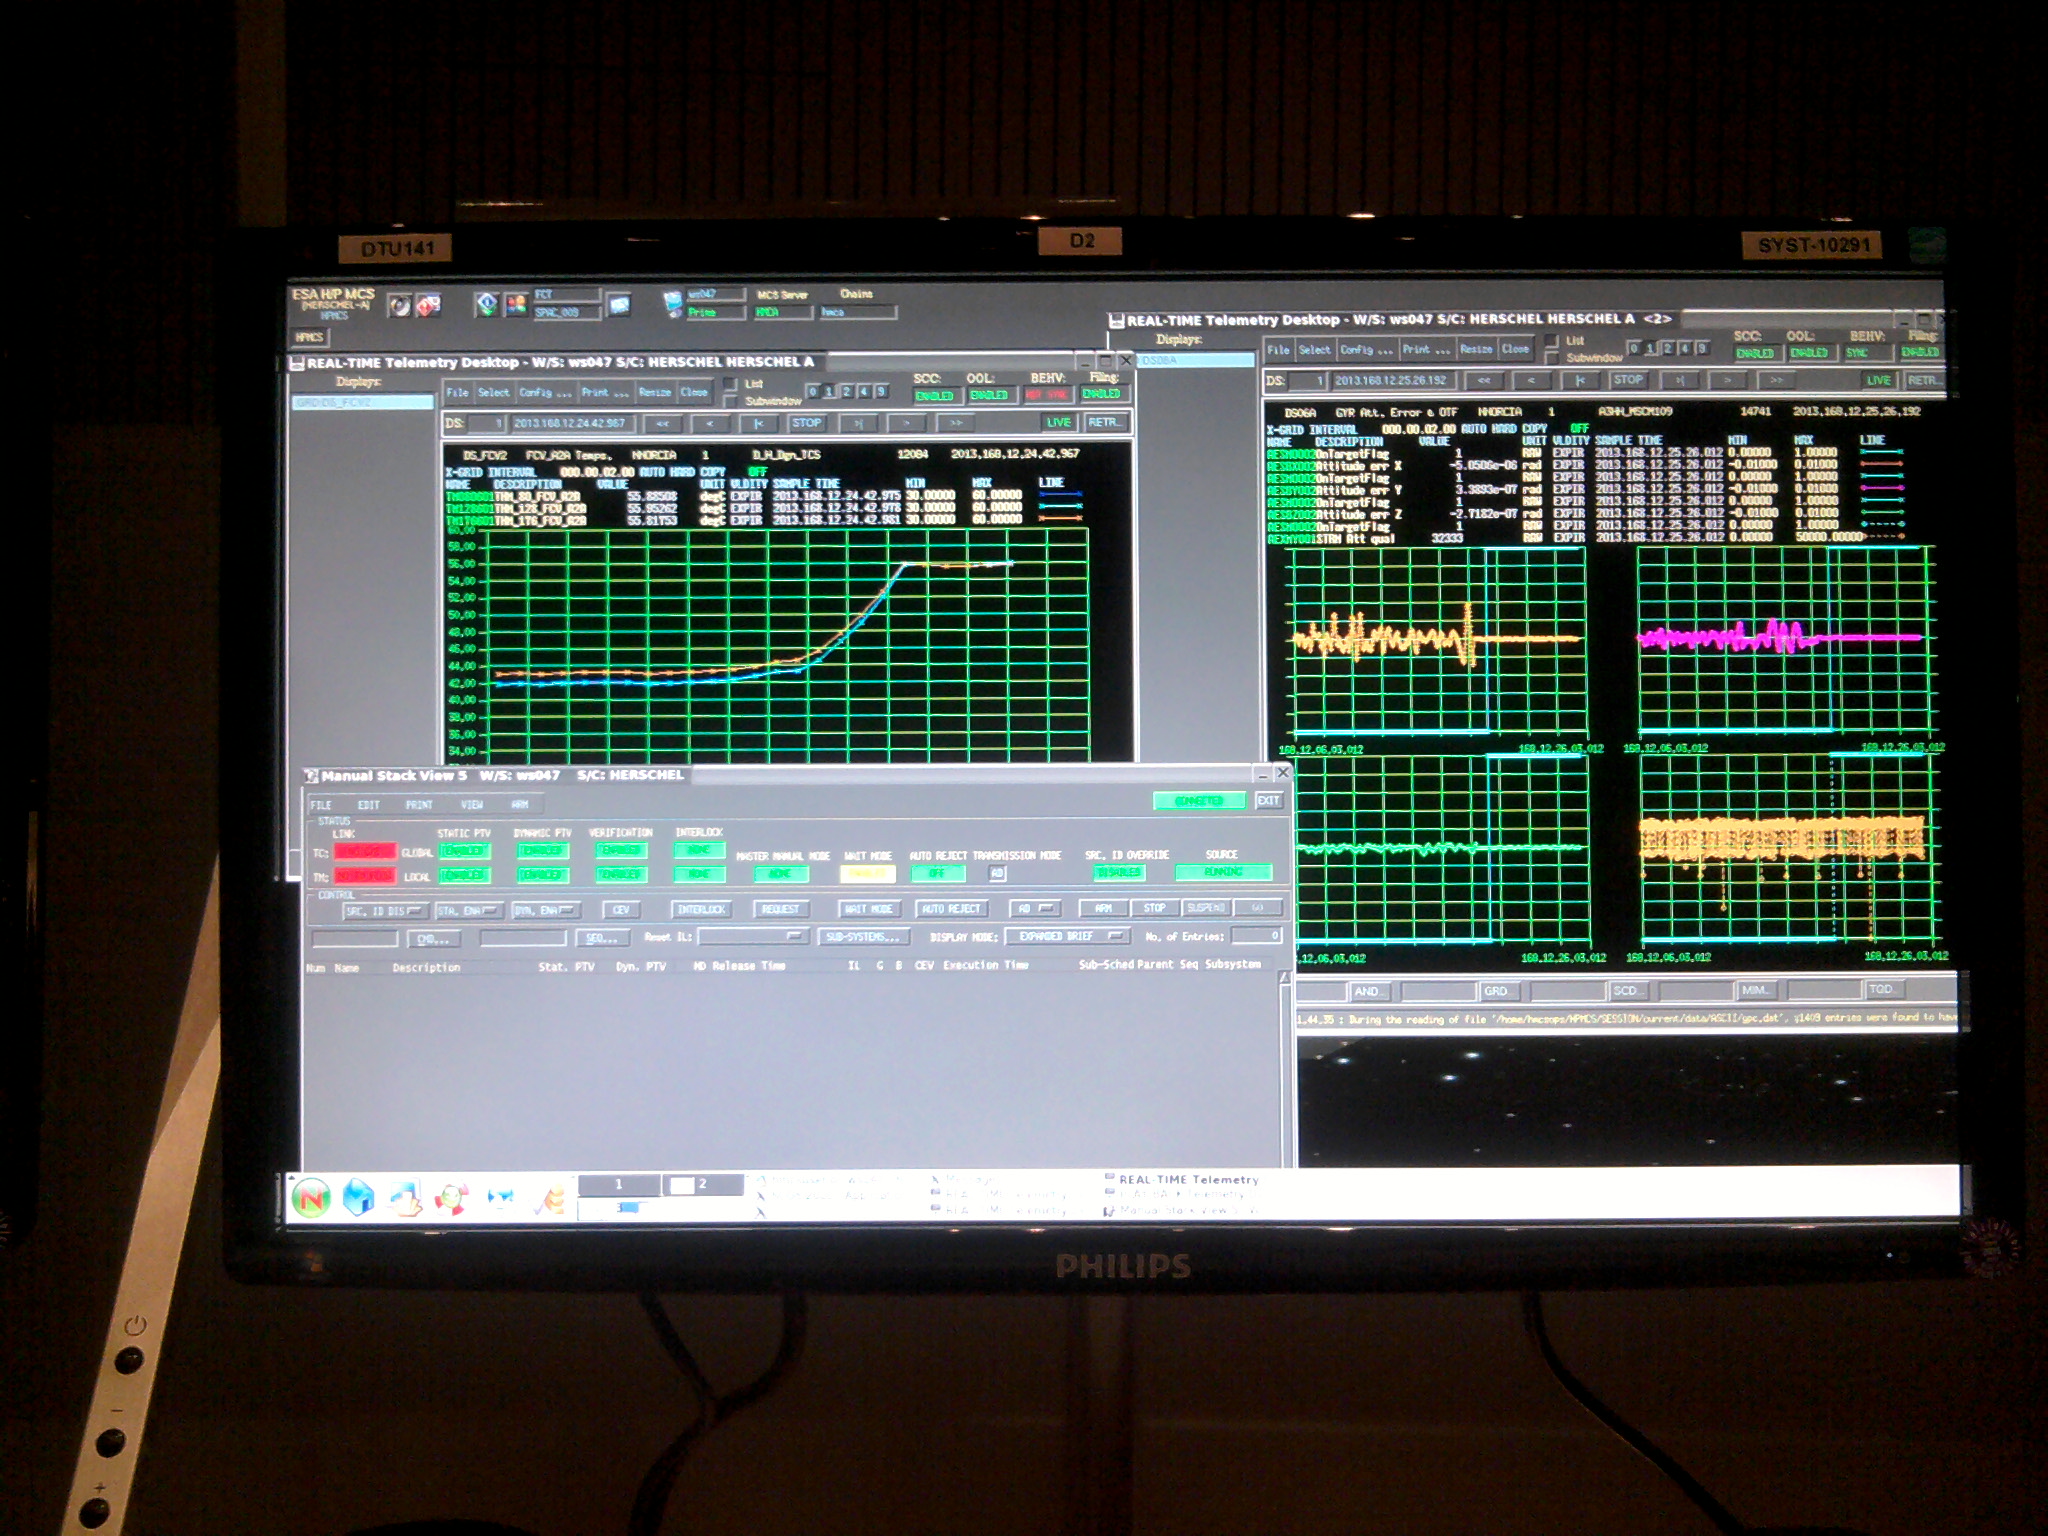
Figure 1.24. Telemetry on one of the consols in the Main Control Room at MOC showing the flatlining of the telemetry after transponder switch-off.
Astrometric observations of Herschel from groundbased observatories were made initially at four pairs of epochs after passivation, the last of them on 2013 July 1 (Figure 1.25). These revealed some small systematic residuals in the position of Herschel compared to the predictions made from the estimated impulse provided by the fuel drain burn. These were due to the difficulty in calculating the exact impulse given to Herschel by the drain manoeuvre with the pressure in the reaction chamber changing as the fuel was exhausted, given that no ranging measurements were available after the burn to give a definitive measurement. A correction derived from the astrometry was introduced into a refined orbit solution for Herschel. This found that the next Earth encounter would be at 8.236 million kilometres distance (21.4 Lunar Distances), significantly more than previously estimated, on October 13th 2027. The exact circumstances of this encounter have an exponential effect on the future evolution of the orbit, hence the interest in fixing the initial conditions as exactly as possible.
![[Note]](../../admonitions/note.gif) | Note |
|---|---|
| As a measure of how sensitive the orbit of Herschel and the circumstances of the 2027 encounter are to initial conditions, the change in estimated encounter distance in 2027 from 19.5 to 21.4 Lunar Distances after the initial orbit update using astrometry to 2013 July 1, was due to a change of 41km in the adopted position of the spacecraft and 1.86m/s on its adopted orbital velocity on 2013 June 18.0. |
The orbit is chaotic over centuries due to perturbations, in particular the cumulative effect of the regular Earth encounters. A small change in the circumstances of the 2027 encounter will have a disproportionate effect on the future orbit evolution. A second factor is that the effect of light pressure on the orbit is unquantifiable because it depends on the rotational state of the satellite once the reaction wheels have run down and no longer maintain it stable. Optical observations made from the ground in late June showed that the brightness of Herschel is varying on short time scales, showing that, as expected, it started tumbling after the reaction wheels had run down. However, orbit simulations made by MOC show that there can be no Earth impact for at least 300 years.
Due to the importance of determining the disposal orbit with the highest possible degree of accuracy, an attempt was made to recover Herschel before it became too faint and distant for ground-based observation. An initial attempt on 2013 September 9 was frustrated by cloud, but observations with the Fawkes South Telescope on 2013 September 10 were successful and a faint image of an object matching Herschel's motion, along the line of variation, obtained. The diference between the corrected and uncorrected ephemeris at this date was 5 arcminutes. Herschel was found to be 42 arcseconds from the prediction of the corrected orbit (corresponding to a 0.5 sigma deviation with respect to the revised orbit solution), allowing a further, significant increase in the accuracy of the orbit to be achieved by taking these observations into account in the orbit calculation. Confirmatory observations were taken with Pan-STARRS-w at Sutherland (South Africa), on September 11th; these are in excellent agreement with a rms residual for the five reported positions over the two nights of 0.32 arcseconds in Right Ascension and 0.38 arcseconds in Declination.
These data gave an approach to 0.057+/-0.002AU (8.5 million kilometres, or 22.2+/-0.8 Lunar Distances) on 2027 October 18, thus the tendency in orbit determinations has been to slightly delay the next Earth encounter and slightly increase the distance of its closest approach. However, the error on the prediction for the 2027 encounter was still extremely large: an error of 6 degrees along the line of variation.
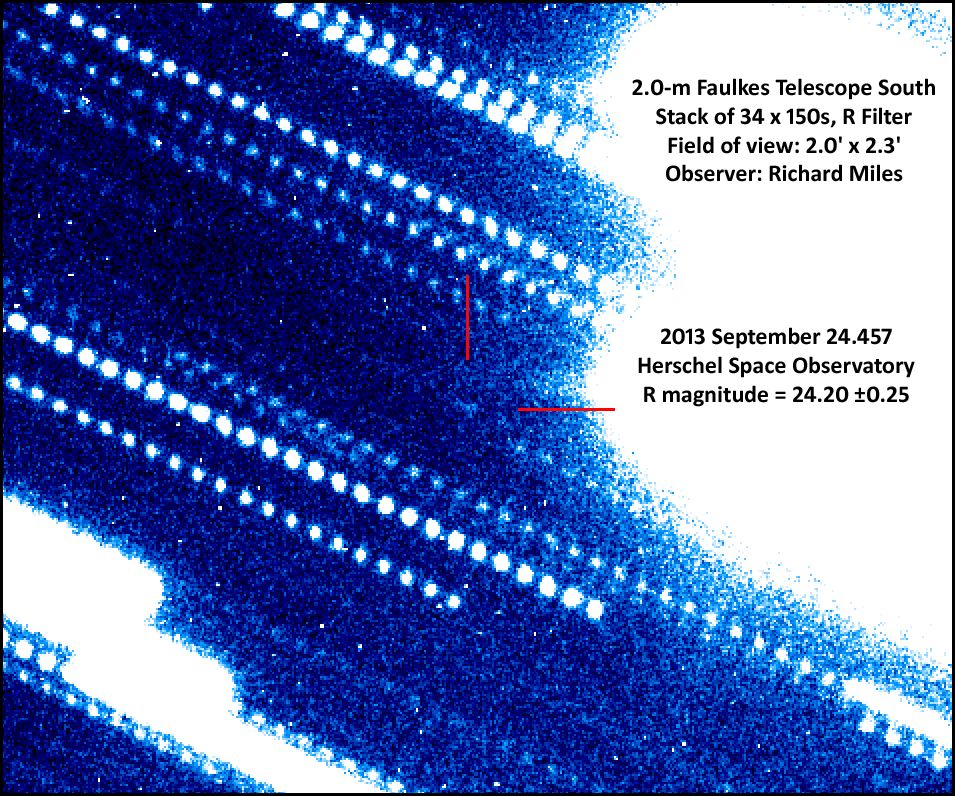
Figure 1.25. The last ground-based image of Herschel taken to date after passivation. This image was obtained on 2013 September 24 by British amateur astronomer Richard Miles, with the 2.0-m Fawkes South Telescope at Siding Spring. The total exposure is 85 minutes in very good seeing, made of 34 individual 150s exposures, tracked on the predicted motion of Herschel. Even in such a deep exposure, taken in good conditions, Herschel is right at the limit of the capabilities of this telescope.
Given the size of the uncertainties, a final attempt to acquire astrometry was made on 2013 September 24. At this date Herschel was at over 25 Lunar Distances and its predicted magnitude was below R=24. A sequence of 34 exposures of 150s each (total exposure 85 minutes), tracked on the predicted motion of Herschel were obtained in good seeing with the 2.0-m Fawkes South Telescope at Siding Spring Observatory. A very faint image was obtained at a magnitude of R=24.2 (Figure 1.25). This reduces the error in the predicted position for the 2027 return to 0.5 degrees, but the long-term orbit solution is limited by the (large) uncertainty in the light pressure term, as the rotational state of Herschel is completely unknown.
The final solution, using 15 observations taken on seven individual nights after the final drain burn, covering an arc from June 26 to September 24, gives an approach to 0.0557 AU on 2027 October 15, equivalent to 21.7 Lunar Distances.
The final orbit is very close to circular -- eccentricity, e=0.013 -- with semi-major axis a=1.042AU and a range from 1.0286-1.0558AU from the Sun. The period is 388.6 days.
Recovery of Herschel by ground-based observation at its next approach in 2027 would allow the long-term average of light pressure term to be calculated and would greatly improve the long-term orbit evolution determination. With the latest orbit solution it is now probable that Herschel can be deliberately recovered at its 2027 close approach by targeted observations and Herschel may even be bright enough to be picked up as a Near Earth Object with unusual motion by some automated surveys operating larger telescopes, such as PanSTARRS. Considerable efforts have been invested into ensuring that, should Herschel be detected in 2027, the orbit quality is good enough to ensure that it can be correctly be identified and that the orbit can be successfully linked to future serendipitous observations, so that it is not misclassified as a natural body in an Earth-threatening trajectory.
With no further ground-based observations reported by the end of September 2013, Herschel became too faint for further detection until its next close approach in 2027 and no further orbit refinement will be possible before then; at the end of 2013 the estimated magnitude of Herschel was around R=26, with the satellite now more than 0.25AU from Earth. The full light curve of Herschel from all ground-based observations from launch is shown in Figure 1.26; Herschel has been observed many times by automated asteroid search programmes searching around the opposition point, which have detected and reported it as an object with unusual motion in the sky. To date, 822 observations by ground based telescopes have been reported.
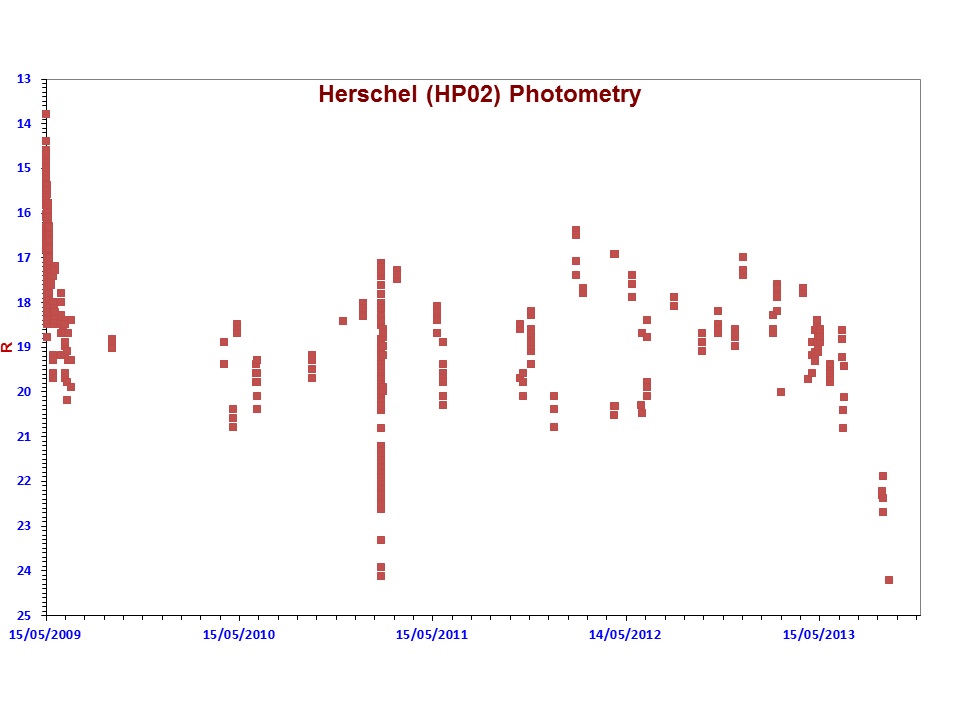
Figure 1.26. The light curve of Herschel from all observations reported to the Minor Planet Center (MPC) from launch until September 2013. During the initial stages after launch the different members of the Herschel-Planck constellation were reported as Planck, HP01 (Sylda), HP02 (Herschel), HP03 (Upper stage), HP04 (unidentified co-orbiter), etc. The brightness of Herschel was strongly dependent on its orientation and was, in a single night of observation, observed to vary by more than 5 magnitudes (greater than a factor of 100 in brightness) according to what reflecting surfaces were presented to Earth as the telescope slewed around the sky. The rapid fade as Herschel moved away from Lagrange in summer 2013 is obvious in this plot.
Observers tracked various members of the Herschel-Planck constellation other than Herschel after launch. The ones with good orbit determinations are: Planck, HP01 (the Sylda) and HP03 (the upper stage of the Ariane 5); HP04 and HP05, both unidentified co-orbiters, have much lower quality orbits and were lost quickly. The main members of the Herschel-Planck constellation and their identification are listed in Table 1.2.
Table 1.2. Members of the Herschel-Planck constellation. Various alternative designations are found for individual members. Typically, in early mission phases, astrometry was reported using the Herschel-Planck (HP) constellation number, or the official launch designation (Year-sequential number). HP04 and HP05 were observed for only a few days and faded rapidly - it is quite likely that these were simply pieces of ice shaken off the cryogenic upper stage at separation. Various other, very faint, co-orbiting fragments that were briefly reported from one or two observing stations were also, almost certainly, small fragments of ice that had separated from the upper stage.
| Object | Official designation | Alternative designation |
| Herschel | 2009-026A | HP02, NORAD 34937 |
| Planck | 2009-026B | NORAD 34938 |
| Upper stage | 2009-026C | HP03 |
| Sylda | 2009-026D | HP01 |
| Unidentified | 2009-026E | HP04 |
| Unidentified | 2009-026F | HP05 |
Planck made its short burn to leave L2 on August 14th 2013. On October 3rd the last science command will be sent, followed by the main burn on October 9th. The final command was sent on October 23rd 2013 after a drain burn on October 22nd 2013. The final orbit is similar to Herschel, although it had less remaining fuel and so has made a rather lower-energy escape. The orbit solution is available here.
HP01 was tracked from May 15th to August 15th 2009. 299 positions were reported. The Sylda made two orbits of the Earth, making an observed perigee pass in August 2009 and an unobserved one in October 2009, before escaping into heliocentric orbit. The orbit solution is available here. Bill Grey from ProjectPluto comments (private communication): "It looks as if it will return in 2025, but on the sunward side where we won't see it... that part is a little vaguer; the astrometry shows some pretty weird things, as if the object wasn't just moving under gravity and solar radiation pressure." The best solution is an approach to 0.052AU on 2025 April 20, but this is quite uncertain. Yarkovsky-like effects may be important in the orbit. Observations made in the nights after separation showed that the brightness of the Sylda was varying rapidly, showing that it was tumbling.
HP03 was tracked from May 16th to September 28th 2009. 353 positions were reported. The orbit solution is available here. Bill Grey from ProjectPluto comments (private communication): "The booster for Planck/Herschel will be back in March 2022, getting back up to mag 22.5 or so." The nominal solution is an approach to 0.092AU distance on 2022 March 30. As for the Sylda, Yarkovsky-like effects may be important in the orbit.
HP05 was tracked from May 16th to 24th 2009. 64 positions were reported from 4 observatories. The orbit solution is available here. Bill Grey from ProjectPluto comments (private communication): "It was clearly responding strongly to solar radiation pressure, i.e., it had to be pretty light. Based on its brightness, it was probably a meter or two across, but had a mass of under a kilogram. (There's some guesswork here, since we don't know the albedo of the object.)" The calculated mass to diameter ratio was exceptionally low for this object (7.2m2/Kg) suggesting that it could be a sheet of ice shaken off the upper stage at separation.
HP04 was tracked from May 17th to 24th 2009. Only 32 positions were reported from 3 observatories. The orbit solution is available here. Bill Grey from ProjectPluto comments (private communication): "HPO4 had a similar brightness (to HP05) and, we assume, a similar size. There are some odd things in the astrometry that make me think it was manoeuvring a bit... maybe gas leaking out of the object." Again, its behaviour was consistent with a rapidly evaporating sheet of ice, which would have caused these asymmetric accelerations. This is supported by the fact that, as for HP05, its brightness dropped more rapidly than could be explained by its increasing distance from Earth.
A number of smaller and even fainter co-orbiting fragments were also detected briefly after launch. None had sufficient observations for a reliable orbit to be calculated and all faded away quickly, suggesting that they were nothing more than small pieces of evaporating ice shaken off the cryogenic upper stage.
The goal of this phase is, within the constraints of time and available resources, to maximise the scientific return from the Herschel mission by facilitating continuing widespread effective and extensive exploitation of the Herschel data. This will continue after the conclusion of this phase (i.e. in the historical archive phase).
Documentation is being extensively revised during this phase to provide a legacy, special legacy documentation is being prepared and the Herschel Interactive Processing Environment (HIPE, see Section below) continues to be updated and refined in line with the state of knowledge of instrument behaviour and calibration and extra functionality is added progressively to allow users to obtain the best possible processing of their data.
The ultimate legacy of Herschel will be the historical archive, plus the sum of all the knowledge, both scientific and technical, derived from implementing and operating Herschel.
One of the major objectives of post-operations is to consolidate Herschel knowledge. This means a complete update of all documentation to bring it up to date with the state of knowledge. In addition, there will be an Herschel explanatory supplement that will consolidate knowledge of both the mission in general and the individual instruments. The aim is to ensure that Herschel knowledge is conserved as a legacy for the future, long after post-operations have ended and the team has dispersed to other missions, or retired.
As an example of how much work and knowledge is embedded in the Herschel software, HSpot consists of approximately 160 000 lines of Java code, while the entire Herschel Common Science System, including HIPE and its documentation, represents approximately 4 million lines of code.
Herschel's interactive processing environment is called HIPE. HIPE was used for all automatic overnight processing as data was received at HSC through the mission and has matured rapidly from its initial, pre-launch versions. HIPE 11 was released in late July 2013, while HIPE 12, built on Java 7, is expected to be released to users towards the end of 2013, or in early 2014. Up to and including HIPE 12, releases have come at six monthly intervals. After HIPE 12, releases will be yearly through to the end of the post-Operations phase, with the final release of HIPE expected to be HIPE 16. Users can find complete information about HIPE here.
During the post-Operations phase, refinement of the calibration of Herschel's instruments will continue as improvements are made in knowledge of the behaviour of the instruments, with more sophisticated processing and modelling. Although the "final" flux calibration at the end of operations was close to the definitive version, small updates and refinements will continue to be made in the future. These will be reflected in the bulk re-processings of the full Herschel Data Archive that will be made periodically when major new releases of HIPE become available, such that the products in the archive are the very best possible at any given time. These bulk re-processings will happen right through the entire duration of the post-Operations phase.
Apart from ensuring the best possible legacy of Herschel documentation during this phase so that future users will be able to understand in detail how Herschel data was taken, what its peculiarities are and how it was processed, even when the relevant experts have moved on to other projects, or have retired completely from ESA, another fundamental objective is to ensure that the final data archive contains the best possible data products. Detailed information on the products in the Herschel data archive can be found in Section 8.1, or may be consulted on-line here.
To this end, all the Key Programmes - i.e. the large programmes which were awarded more than 100 hours of observing time by HOTAC - and the larger Open Time and Guaranteed Time programmes from the OT1 and OT2 Calls are invited to send their interactively processed data products to be incorporated in the Herschel Data Archive of User Provided Data. The User-provided data is of three basic kinds:
- Highly processed data (i.e. well beyond a quality obtainable with automatic pipeline processing).
- Published or publishable data (i.e. the final version of data that was used in publication(s), or that is to be published imminently).
- Data catalogues (i.e. catalogues of sources detected in the processed data, with its associated parameters).
Some of the user-provided data sets are very large. For example, the catalogue of extragalactic sources to be provided by the ATLAS consortium will contain approximately one million entries.
One of the features of user-provided data products is the fact that OBSIDs are linked to publications. In particular, it is possible to track what OBSIDs have been used in a particular publication and vice-versa. There is a link to an explanatory document published with the data set from each project, which may be a ReadMe file describing the dataset, or a data publication describing in detail how the data was obtained and processed.
All Herschel catalogues and observing logs will be available through VIZIER. As of early October 2013 the Herschel observing log is available for consultation in VIZIER.
Another aim of post-Operations is to maintain a complete database of all publications made using Herschel data and link OBSIDs in the database, whether user-provided or not, to the publications in which they appear. Authors are strongly encouraged to list the OBSIDs that they use in publications to facilitate this tracking. As of December 2013 there were already 843 refereed papers published using Herschel data that are listed in the publication database, 809 of which (96%) had associated OBSIDs linked to the publication, while 34 more were yet to be examined at that point. This represented 34.7% of all the observing time awarded by HOTAC already being published in at least one refereed paper.
The publication database can be consulted here and will be updated constantly throughout post-operations.
The historical archive phase is outside the funded Herschel mission. This phase commences after the end of the post-operations phase.
The historical archive will provide access to all Herschel observations and derived products. The products will all be derived in the archive consolidation phase, during the post-operations phase, in a consistent manner and to consistent standards, using the best knowledge of Herschel instrument calibration and data processing. In addition, the software, documentation -- manuals, etc.-- and tools will be available from the historical archive.