Table of Contents
Herschel flight operations have been divided into a series of phases from the moment of launch. Broadly, these are check-out (in the first six months after launch), routine operations (from then until the end of helium) and post-operations (from end of helium to the end of all Herschel activity), each with their individual sub-phases. In theory, each mission phase should have an exact, identifiable start and end point but, in reality, the requirements of operations and the differing needs of the three instruments have made the different mission phases blend progressively into each other, with slow transitions and no clear start and end point. Similarly, the HIFI anomaly that occurred almost three months into the mission, when a chain of events, triggered by an SEU (see Section 4.2.1.3), led to a power surge that disabled the primary power chain, meant that HIFI was delayed by about 6 months with respect to PACS and SPIRE in entering routine operations. The anomaly obliged HIFI to go back for a time and re-conduct check-out activities that had already been completed months earlier, using the recovered systems on the back-up power chain.
Overall, despite the HIFI incident, Herschel operations have ran smoothly, largely due to the success of the long and intensive pre-flight test campaign process, first at ESTEC and later at Kourou. As a result, some activities could be advanced considerably over the anticipated pre-launch schedule. Despite the arduousness of the post-launch check-out and commissioning plan, remarkably few of the 298 planned check-out activities failed for such a complex mission, thus requiring much less re-planning of in-flight tests than might otherwise have been expected and, hence, an earlier start to the first science observations than was anticipated pre-launch.
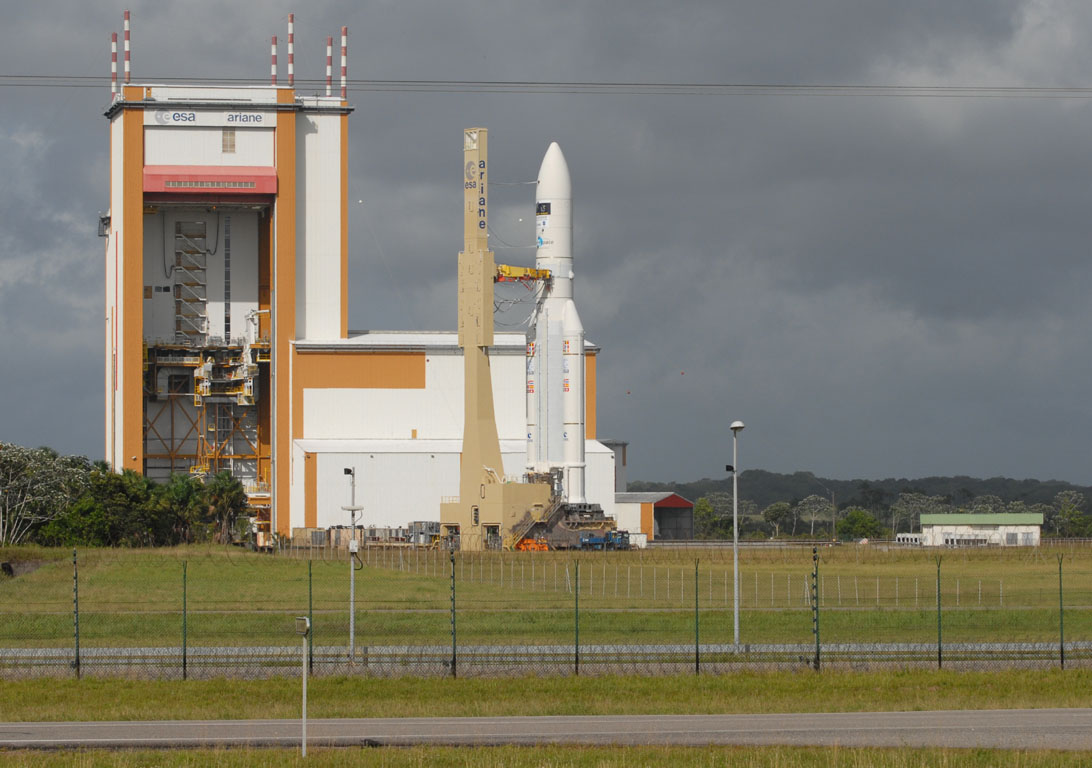
Figure 1.1. Roll-out of the launcher for the Herschel-Planck mission on 13 May 2009 with the dark, threatening storm clouds visible behind.
The only other serious instrumental issue to occur during the entire mission was the loss of one of the two matrices of the PACS 160 micron array, on February 16th 2013, just two and a half months before the end of helium, although, as the second matrix continued to function perfectly, this only had a small impact on science, reducing the sky area covered at 160 microns and thus reducing senstitivity in maps in this band by about 30% but, thanks to careful re-design of observations, the effects of the failure on observations was largely mitigated for most observers.
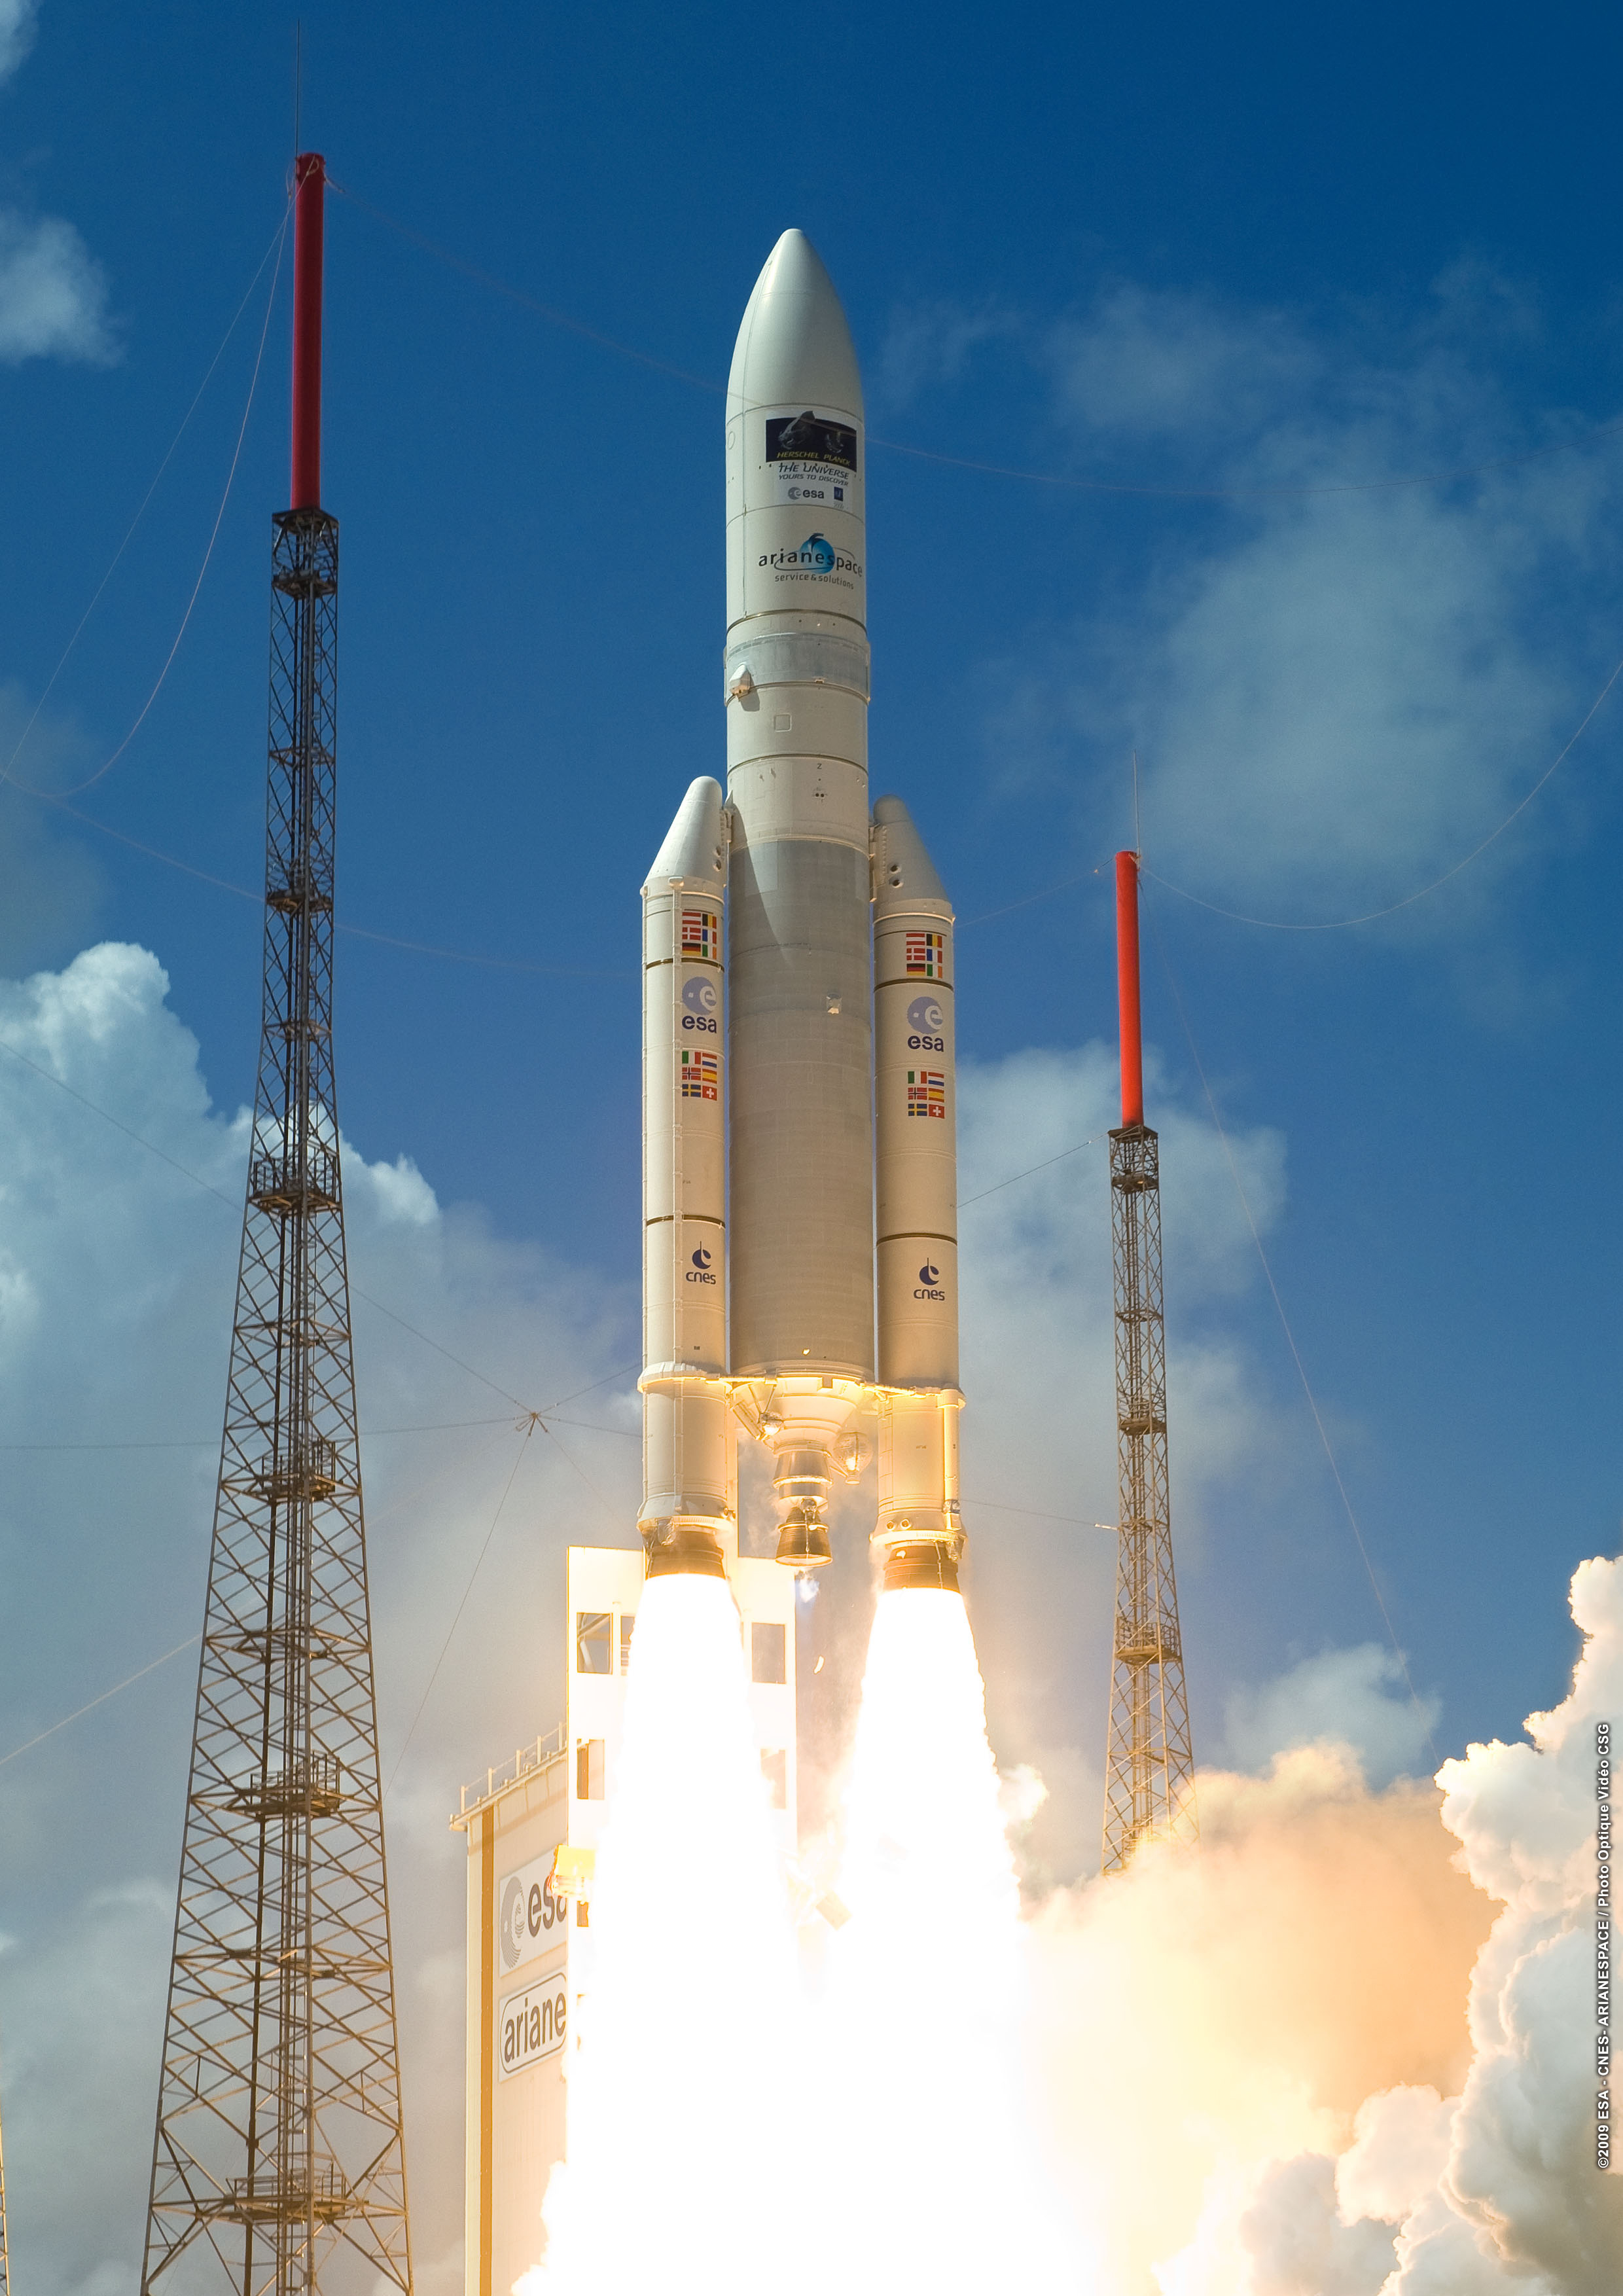
Figure 1.2. Launch of the Herschel-Planck mission on an Ariane 5-ECA at 13:12:02UT on 14 May 2009. The Herschel-Planck mission logo is clearly visible at the top of the fairing. The fine weather and clear blue sky contrasts sharply with the conditions for roll-out (Figure 1.1), or those prevalent only a few hours before launch as the VIPs were taken to the launch viewing area in heavy rain during an intense storm.
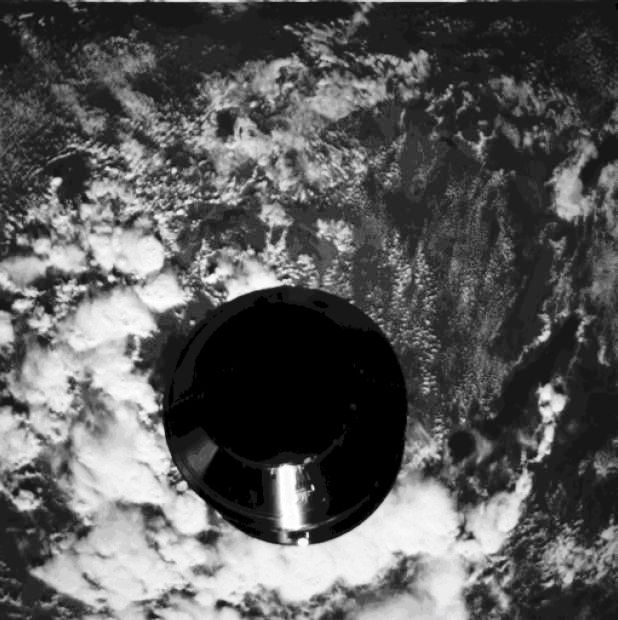
Figure 1.3. Herschel flies free! The moment of separation of Herschel from the Sylda, which is still attached to the upper stage and covering Planck. This image was taken with the backward-facing camera on Herschel: called the VMC. The coastline and cloudscape below Herschel are clearly visible.
Roll-out (Figure 1.1), prior to launch, was conducted early on the morning of 13 May 2009 and, after a flawless countdown, launch occurred at 13:12:02UT on 14 May, at the first possible opportunity as the launch window opened. Although there had been storms and heavy rain as the guests were being transported to the VIP area prior to launch, the clouds disolved and launch conditions were perfect. Figure 1.2 shows the Ariane 5 blasting off with the Herschel and Planck on board. The critical early milestones of fairing release, Herschel separation (at 13:37:55UT, Figure 1.3) from the Sylda and signal acquisition (at 13:49UT) all passed successfully. The frst command sent from the ground was executed by Herschel 58 min after launch at 14:10UT.
Launch occurred as the launch window opened, only 40 hours after the fairing was closed. This considerably reduced boil-off on the launch pad and gave a helium temperature at launch of only 1.81K, at the lower end of expectations, maximising the cryogenic lifetime in space.
After separation from the Sylda (Figure 1.3), Herschel began its cruise to Lagrange. A single injection manoeuvre was made 26h after launch. This injection manoeuvre started at 15:16:25UT and lasted 22.5 minutes, giving a Delta-V of 9.0m/s. This injection manoeuvre placed Herschel in what was very close to its final orbit. After the injection, a touch-up was made, 75 hours after launch, giving a further Delta-V of 1.0m/s. Two Orbit Correction Manoeuvres were made during transfer: the first, of 73cm/s, approximately 4 weeks after launch, the second of 17cm/s approximately 5 weeks after launch. No further corrections were required apart from the tiny, regular station-keeping burns of typically 20-30cm/s with the thrusters, made approximately every 8 weeks to maintain the orbit around L2 -- 21 of these station-keeping manoeuvres were executed in total during Herschel's 4 years around L2. Unlike for Planck, no braking manoeuvre was required to place Herschel in a stable manifold around L2.
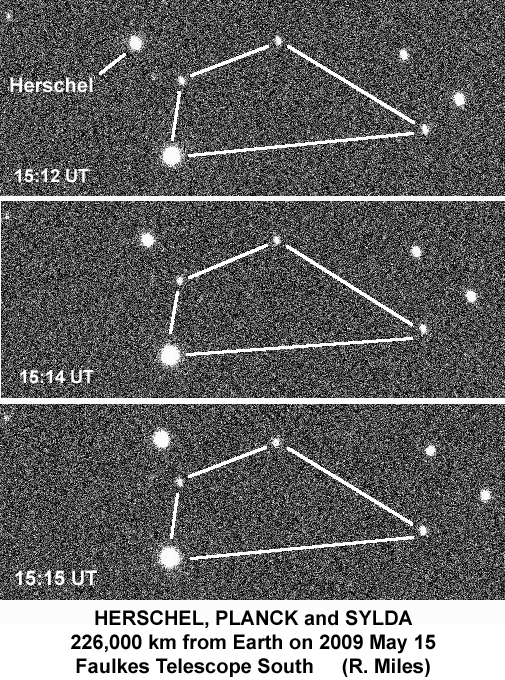
Figure 1.4. A sequence of images taken by British amateur astronomer Richard Miles using the 2-m Fawkes South Telescope in Australia, of Herschel (right), Planck (left, incorrectly labelled as Herschel) and the Sylda between the two, 26 hours after launch, at approximately half the distance to the Moon. These were the first observations of the Herschel-Planck constellation to be reported. The movement of the three relative to the stars in the three minutes between the first and last image is quite obvious.
Numerous images and animations were taken of the Herschel/Planck constellation as it receeded from Earth, mainly by amateur astronomers. Figure 1.4 shows the first image of Herschel, Planck and the Sylda to be reported from anywhere on Earth, taken approximately 26 hours after launch, when they were already 226 000km from Earth (approximately 0.5 Lunar Distances). This image was taken with the 2m Faulkes South Telescope. It is already obvious from this image how Herschel and Planck were released into slightly different transfer orbits due their differing injection requirements for L2 orbit. Excellent animations of the cruise phase of the Herschel/Planck constellation were taken by Peter Birtwhistle from Great Shefford Observatory in the United Kingdom (Minor Planet Center site code J95) on May 15th:
http://www.observadores-cometas.com/Herschel/images/Herschel_Planck_Sylda-090515-J95.avi
and by Gustavo Muler from Nazarth Observatory, Lanzarote, Spain (Minor Planet Center site code J47), on May 16th (from top to bottom in the animation: Herschel, Sylda and Planck)
http://www.observadores-cometas.com/Herschel/images/hershelplank_avi.gif.
The rapid variability of the tumbling Sylda is obvious, particularly in the Birtwhistle animation. It is also noticeable how the much larger Herschel actually appears considerably fainter than Planck in most of the images. Throughout operations in space Planck was consistently about a magnitude brighter than Herschel as it presented a greater effective surface area to Earth.
After launch, a Low Earth Orbit Phase (LEOP) started during the first stages of the cruise to Langrange. An initial phase of check-out started with the telescope closed and the instruments switched off, while the operation of the spacecraft sub-systems was checked. At this time the satellite was placed in a Sun-orientation, allowing the spacecraft to cool in the shadow of the sunshade and to outgas. However, given the danger of volatiles from the satellite condensing on the telescope, the mirror itself was heated during the initial cooldown phase to avoid it acting as a cold-trap for the outgassed volatiles. This period involved checking basic properties of the satellite (centre of mass, moments of inertia) and proper functioning of basic spacecraft sub-systems (Radio Frequency (RF), thermal control, power sub-system, data handling, attitude and orbit control, thrusters, Solid State Recorders (SSR), etc.) for spacecraft operations.
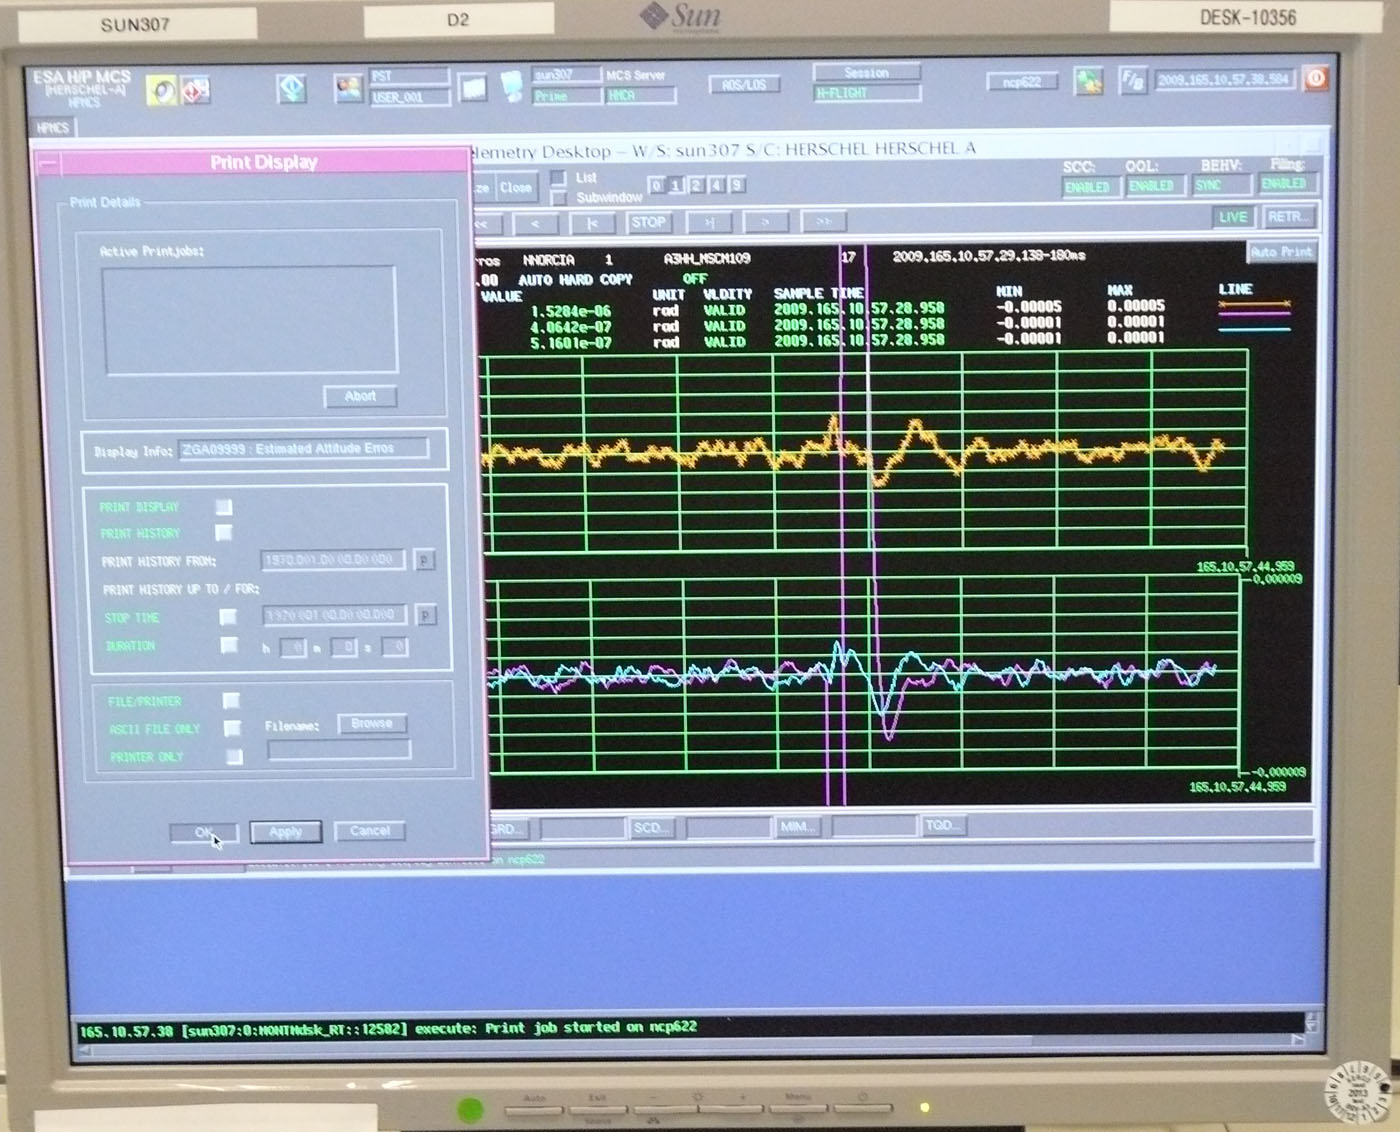
Figure 1.5. The telemetry received at MOC showing the oscillation in gyro response measured by the current to the gyros as the heavy cryocover swung open and oscillated, causing the entire satellite to wobble slightly until it had reached a stable open position. The large oscillation seen in this gyro signal (marked by the mauve coloured vertical lines on the monitor screen), showing the gyros activating to stabilise the satellite orientation, was the first evidence that the cryocover opening had been carried out successfully. Five or six oscillations occurred before the spacecraft stabilised completely again.
While spacecraft check-out was underway, initial activities to check-out the instruments could commence. The first instrument to be switched on to start payload operations was SPIRE on Day 6 after launch, as the heat generated by its electronics also helped to keep the temperature of the service module within its nominal operating range. PACS and HIFI switch-on took place on Day 11. Initial switch-on simply consisted of checking that the measured voltages were in the expected range from the telemetry. This led into a long and extremely detailed set of tests and checks of the functionality of each instrument that was the Commissioning Phase.
Once Herschel was successfully launched and injected into the transfer trajectory towards the operational orbit, the spacecraft and instrument commissioning phase started. This consisted of a series of 298 individual tests and activities to check-out all aspects of instrument and spacecraft functionality. A highlight of Commissioning was the opening of the telescope cryo-cover. This cover protected the cryostat from condensation of outgassed volatiles. The cryo-cover was opened at 10:53UT on Sunday 14 June (12:53 local time at Darmstadt). This involved arming and then firing explosive bolts to free the cover, after which a spring pulled it into an upright, totally open position after a series of oscillations during which a spring steadied the heavy cryocover into a fully open position. The oscillations of the cover caused the gyros to activate to stabilise the spacecraft pointing as the cover was heavy enough to make the whole satellite move slightly in reaction to the movements of its opening, before finally coming to rest in an open position (shown in Figure 1.5). This gyro signal, showing five or six oscillations, was the first confirmation that the cryocover had opened, although it was not until the first images were received the following day that final confirmation was available that the cryocover opening had been a complete success.
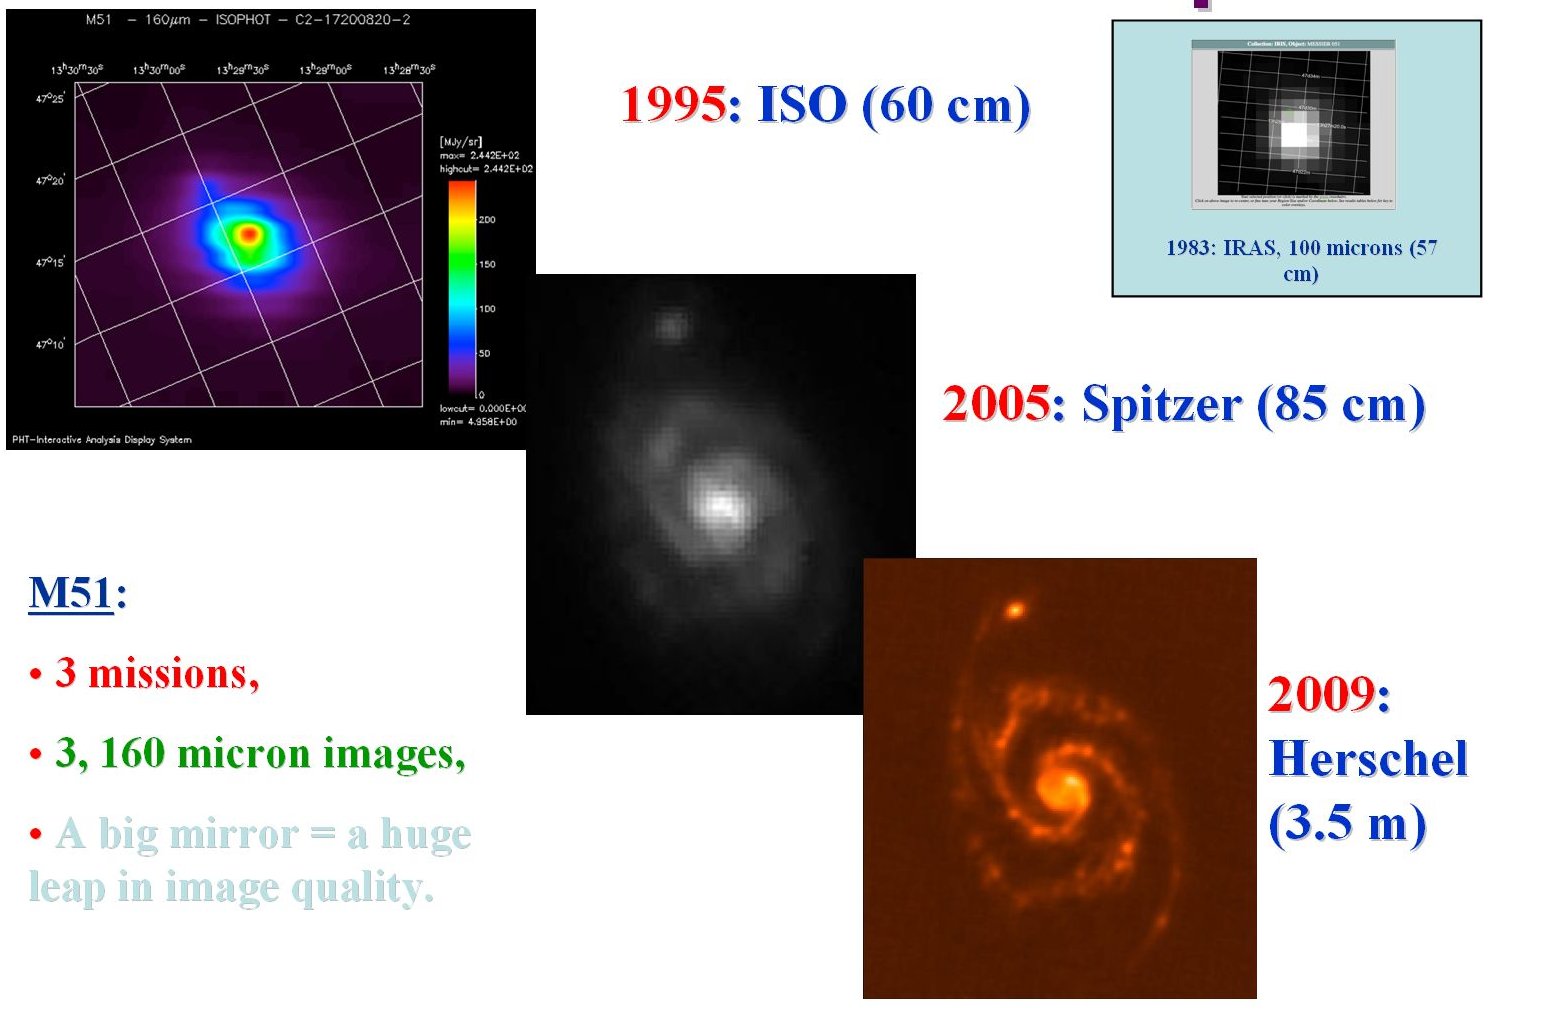
Figure 1.6. A comparison of images of M51 at 160 microns for ISO, Spitzer and the Herschel sneak preview image, showing the improved resolution and sensitivity from Herschel's larger mirror. No comparable image exists from IRAS, which had a long wavelength cut-off of 100 microns, so the IRAS 100 micron image is shown for comparison. The comparison of images also reflects the vast improvements in detector technology over the years.
With the successful cryocover opening and the encouraging progress of commissioning activities, an opportunity was seen to take some early images to make a blind test of the telescope focus and image quality in advance of formal First Light. A series of PACS exposures were defined with a range of bias settings, scanning through the most likely range of values, in a test that was termed the "Sneak Preview". After consideration of several possible targets, the galaxy M51 was selected for the Sneak Preview for various reasons, especially the fact that it was available at the right time of year to be observable by Herschel and, being a large, bright object, the galaxy is a classic infrared target with a lot of structure, so considerable prior imaging existed at similar wavelengths with which the Herschel images could be compared (Figure 1.6) to check the image quality to ensure that it met expectations. The resulting images are shown in Figure 1.7, which showed that the telescope focus and alignment were excellent and that the optimum parameters for imaging were close to the best guess values estimated by PACS prior to cryocover opening.
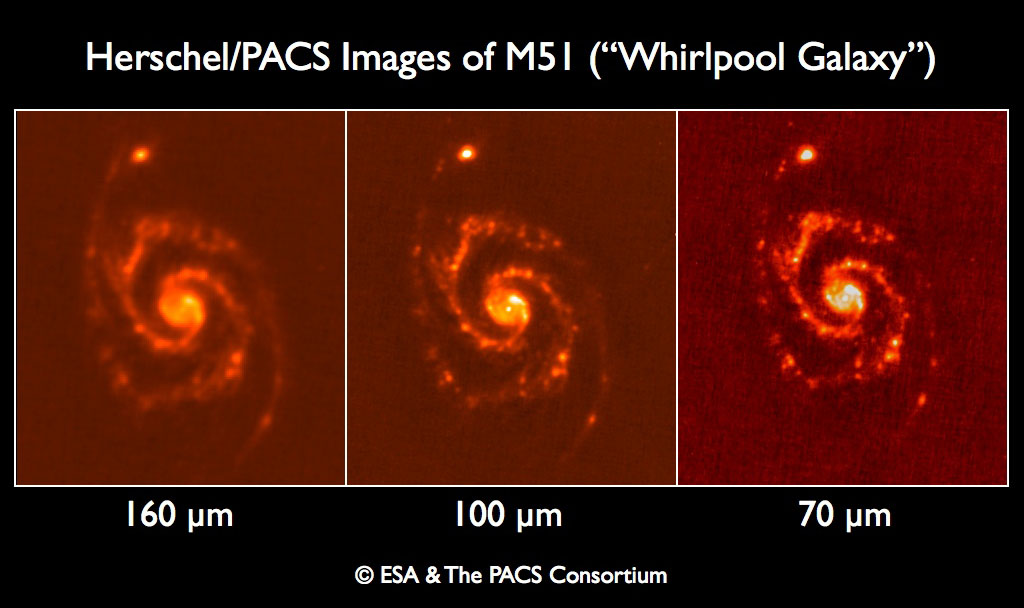
Figure 1.7. The Sneak Preview images of M51 in the three PACS bands, taken blind after cryocover opening on June 14/15th 2009.
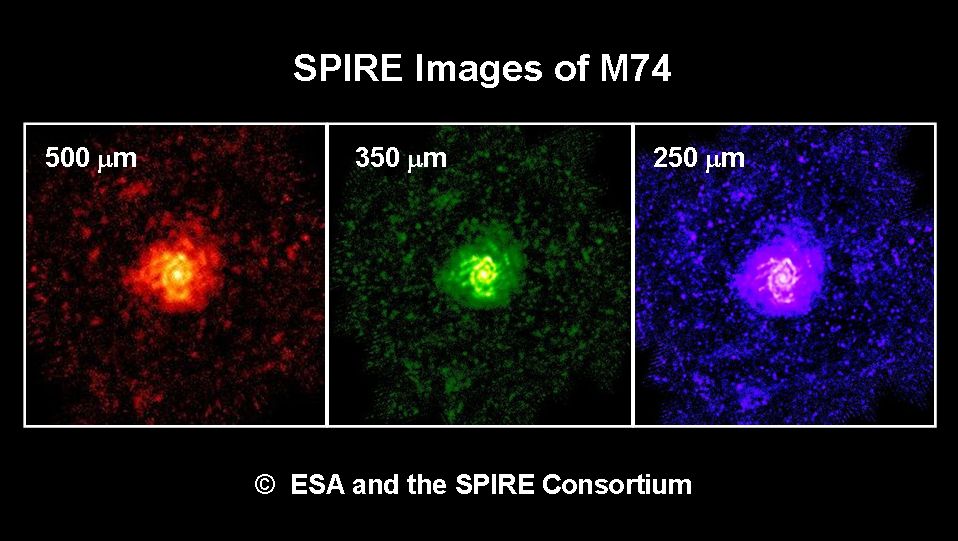
Figure 1.8. The SPIRE First Light images of M74 (NGC 628) in 250, 350 and 500 microns, obtained on 2009 June 24. Messier 74 is a face-on Sa galaxy in Pisces, at approximately 32 million light years distance with a visual diameter of approximately 10 arcminutes.
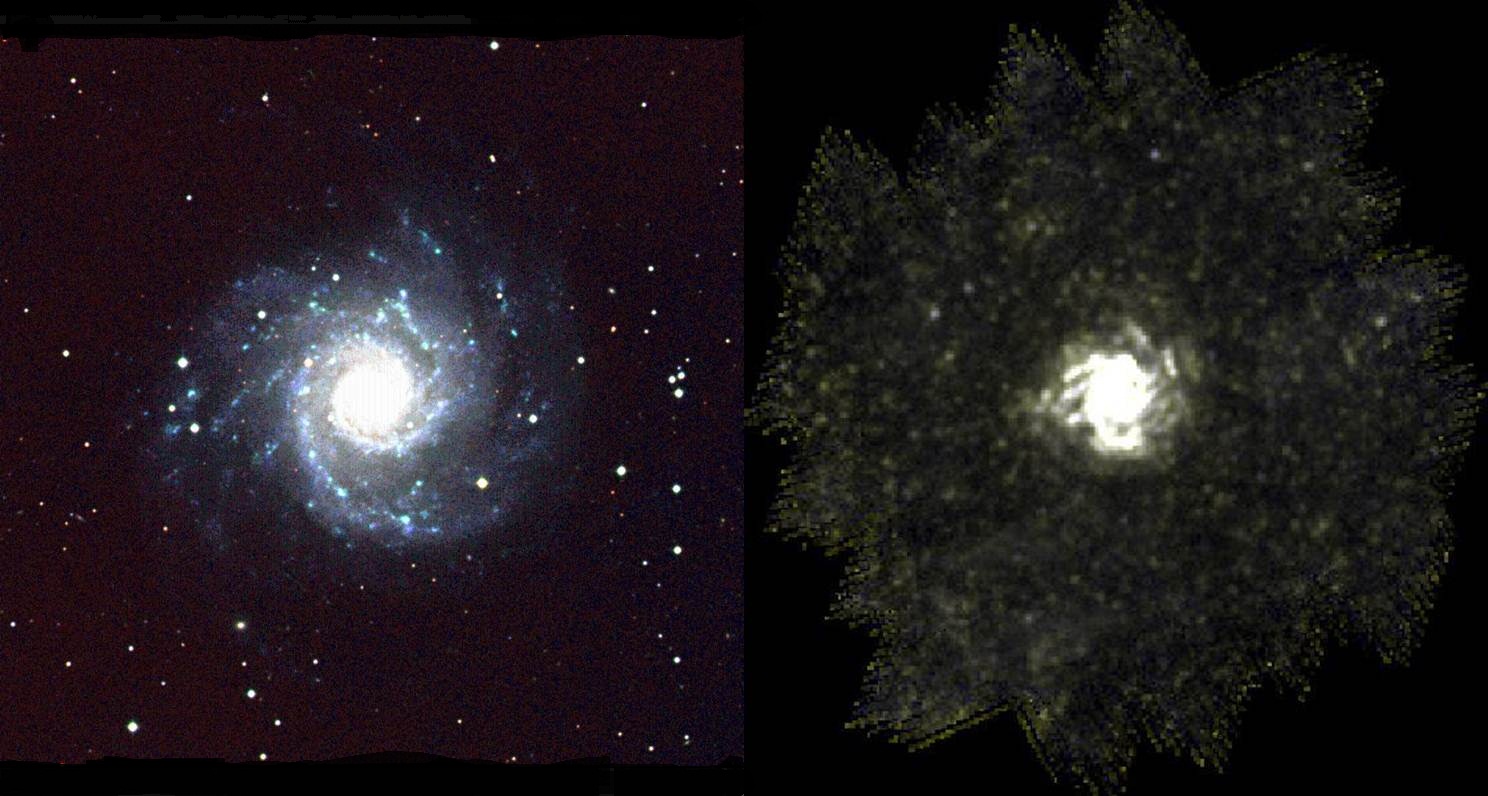
Figure 1.9. The SPIRE First Light image of M74 (NGC 628) combined as an RGB image (B=250 microns, V=350 microns, R=500 microns), obtained on 2009 June 24, compared with a Palomar Sky Survey RGB image on the same scale (blue layer = B, green layer = R, red layer = I) to show the comparison between the SPIRE first light image (right) and the Palomar Observatory Sky Survey image (left). This comparison shows where the star forming regions of the galaxy, bright to Herschel, are situated.
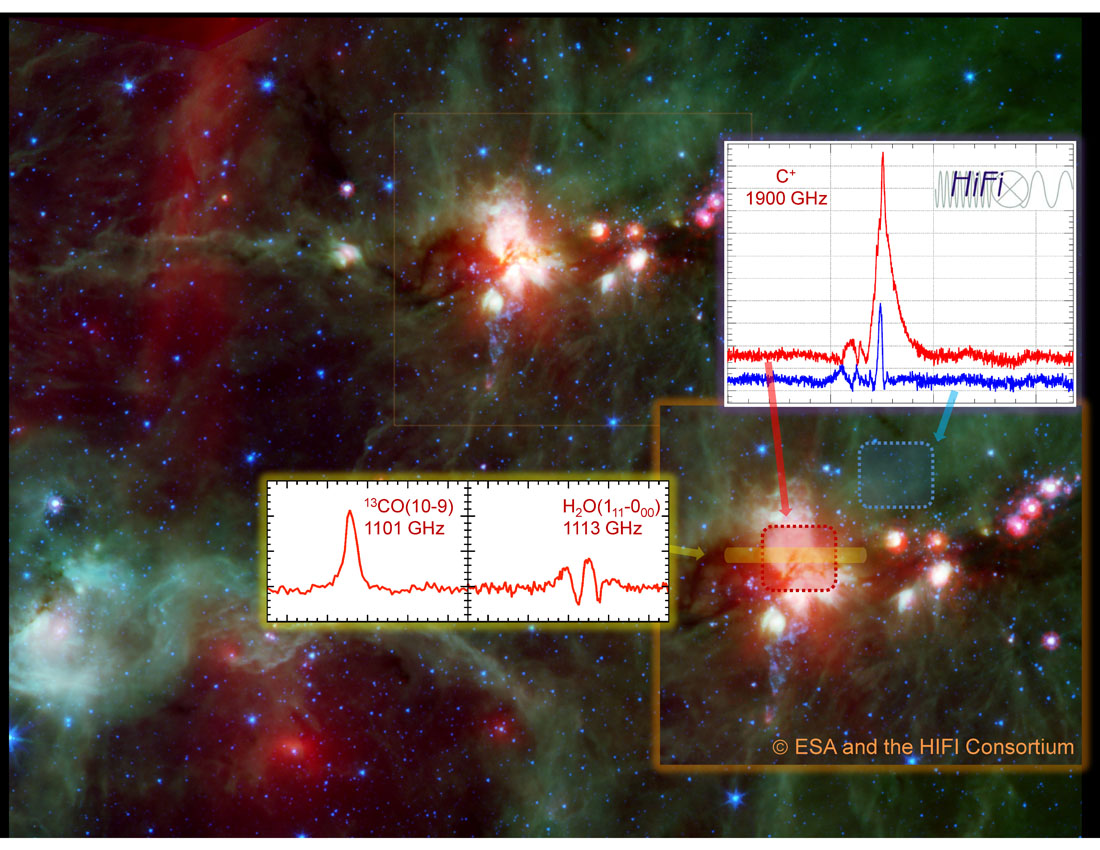
Figure 1.10. The HIFI First Light spectra of DR21, obtained on 2009 June 22, superimposed on a Spitzer image of DR21 and its surrounding region. In the inset we see an enlargement of DR21, which is part of a large star-forming complex in Cygnus, with the positions where the three HIFI spectra represented were taken, superimposed on the image.
Once the Sneak Preview had shown that the image quality was as good as had been anticipated in all senses, a more ambitious series of formal first light observations were scheduled for each of the instruments to demonstrate their capabilities, of which a sample is shown here (Figure 1.8, Figure 1.9, Figure 1.10).
PV phase was designed to obtain in-flight characterisation of all instruments e.g. in terms of stability, sensitivity, resolution, timing and other calibration parameters. It included the validation of the instrument observing modes and the calibration and data processing of the resulting data. To achieve this, a schedule of astronomical observations and internal calibrations, defined and iterated pre-launch, covering a nominal period of 2 months, were be executed using normal observatory procedures. This schedule was be based upon an agreed in-orbit calibration plan generated jointly by the ICCs and the HSC. The plan contained a description of all planned calibration activities and associated calibration sources (internal and astronomical) required to characterise fully each instrument.
Each instrument received blocks of time, normally of two days each, to carry out its activities according to the agreed PV plan, giving each instrument "two days on and four days off", allowing data to be processed and new observations prepared, albeit on an extremely intensive cycle. Weekly meetings then examined the progress of the planned tests, adjusting the plan to allow extra time for failed tests to be repeated, where necessary, or for extra tests to be included. PV Phase started 64 days after launch - in line with pre-launch plans - and, by 120 days after launch had delivered the first fully calibrated and usable observing modes for science scheduling.
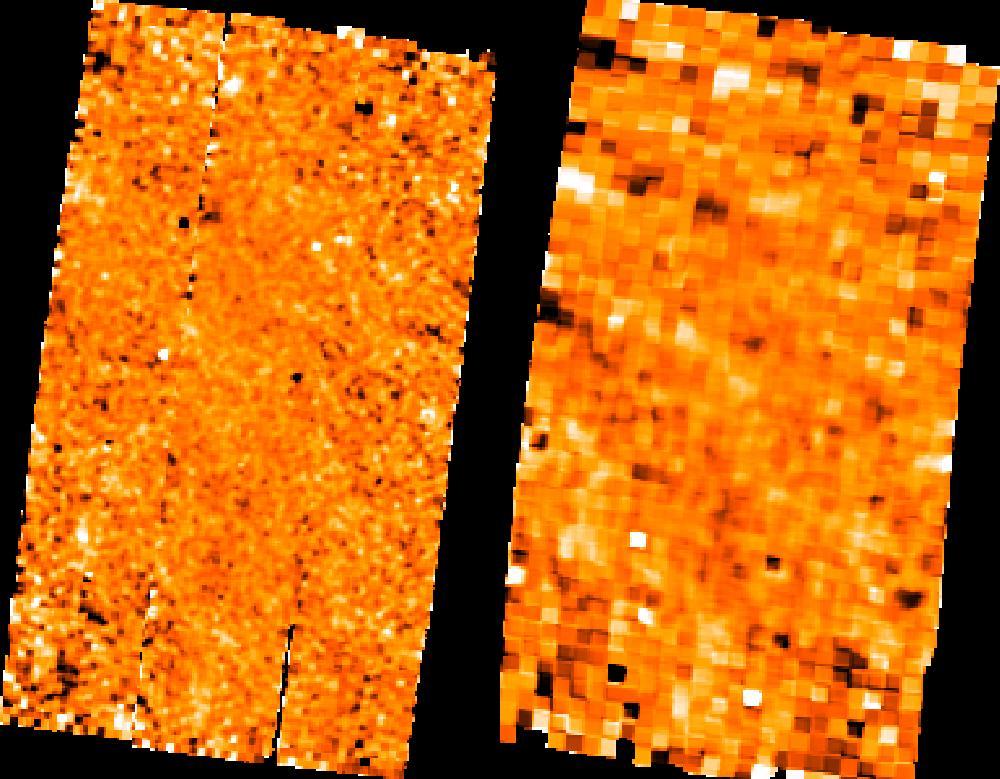
Figure 1.11. The browse product for the first successfully processed scheduled science observation made by Herschel. This is OBSID 1342183651 of the QSO SDSSJ1602+4228, made for AOTVAL_kmeisenh_2, a 2799 second exposure starting at 15:52:46UT on September 11th 2009 in Point Source Photometry mode showing an apparent faint detection at 160 microns (right hand image) where we see the weak pattern of negative and positive images from the chop/nod cycle that must be combined to give the final image and photometry. The left hand image was taken at 70 microns.
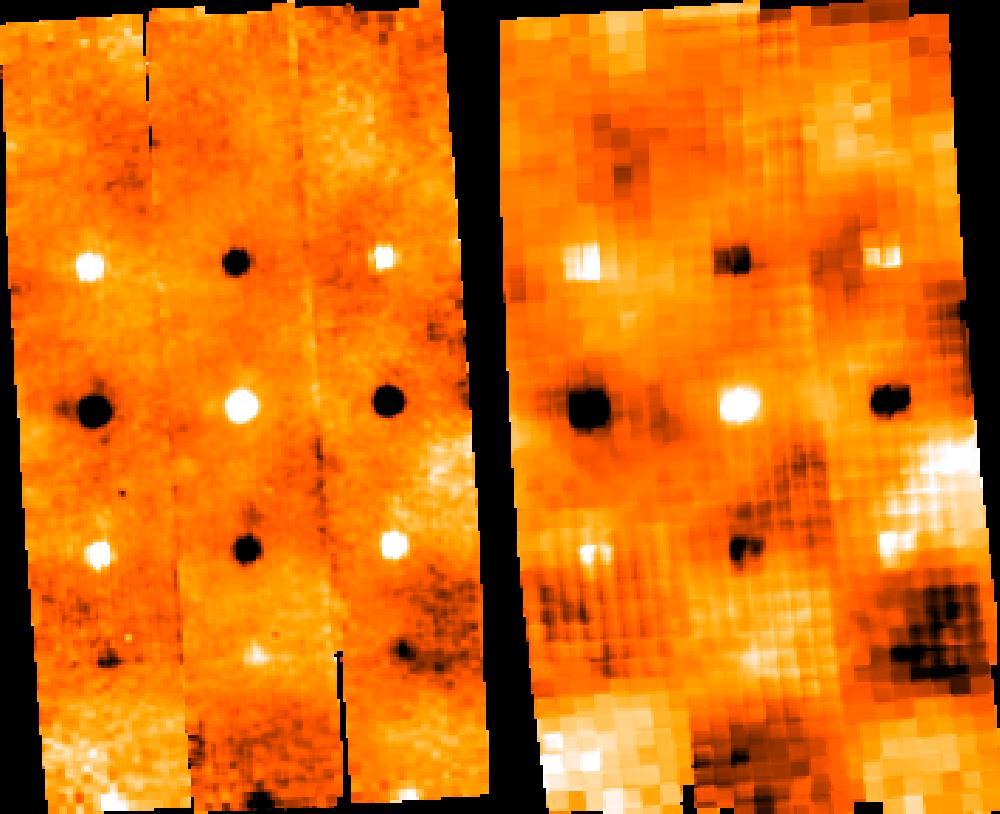
Figure 1.12. The browse product for the first scheduled science images taken of a Solar System Object (SSO) made by Herschel. These are OBSIDs 1342183654 (top, 100 microns left, 160 microns right) and 134218365 (bottom, 70 microns left and 160 microns right) of Pluto, made for AOTVAL_thmuelle_2, starting at 17:01:46UT and 17:30:17UT on September 11th 2009 in Point Source Photometry mode. We see the pattern of negative and positive images from the chop/nod cycle on the individual photometer matrices, which must be combined to give the final image and photometry.
Once an observing mode was validated and considered ready for scientific use by the relevant Instrument Control Centre (ICC), a "Release Telecon" was held at which the observing mode was discussed in detail and all aspects of its readiness for release to the scientific community were discussed, including any final actions necessary to complete readiness for release, any documentation required and any caveats on use of the mode that should be communicated to the users. Once formal release was authorised, the Mission Planning Team at HSC would start to schedule routinely observations using that mode from the pool of approved observations in the database. In the early mission stages, to speed up scheduling of science observations, on some occasions an experimental version of an observing mode was scheduled to test and optimise it taking real science: these observations can be identified as they were labelled "AOTVAL", for AOT Validation and were taken on a shared risk basis, allowing some groups to obtain very early science data that could be used to refine their programmes.
PV Phase blended progressively into the Science Demonstration Phase of Routine Operations, without a formal end, with days assigned to PV activities becoming increasingly infrequent. Apart from HIFI recovery activities to check that the instrument was functioning correctly on its back-up chain after the incident in July 2009 that stopped observations, which ran in four dedicated blocks between 22 January 2010 and 17 March 2010, the last PV day included as such in the observing schedule was 8 December 2009. After this, remaining PV activities to test and validate remaining observing modes were absorbed into routine calibration activities for each instrument, as were the activities designed to test and validate the new, second-generation observing modes that were offered later in the mission.
A number of observations, taken as calibration observations, even relatively early in the mission during the PV Phase, have science quality and have subsequently been published. In some cases these calibration observations have been "bought" subsequently by a HOTAC-approved programme against its time allocation and thus promoted to science observations. However, the first science observation to be taken with Herschel that had been approved by HOTAC and was formally scheduled as a science observation, was a 159 second point source photometry observation of the protoplanetary disk J0843.3-7905 from the programme AOTVAL_bdent_2, cloned for the purpose from programme KPOT_bdent_2, starting at 15:28:21UT on September 11th 2009 (OD-120). This observation can be found in the Herschel Science Archive with OBSID 1342183650. A total of fourteen point source photometry observations were taken on OD-120, including AGNs (Figure 1.11), debris disks and a Solar System Object (Pluto, Figure 1.12).
One of the conclusions of the early observations in point source photometry mode was that the mode offered lower sensitivity than was hoped, leading to the mode being retired early for science use, although still used for calibration observations throughout the mission and, particularly, to carry out regular pointing calibration measurements to make a systematic check of the pointing quality. This mode was replaced by the mini-scanmap mode.
PACS scan maps were first used for scheduled science observations of HOTAC-approved programmes, in AOTVAL Mode in OD-127 (September 17th 2009), the first target being RCW 120 for AOTVAL_fmotte_2.
As PV Phase activities reduced, there was a progressive transition into "Science Demonstration Phase", in which each approved Herschel science programme had the opportunity to nominate a part of its observations -- typically 5-10% -- to be carried out early. The aim was to carry out observations and observing programmes that would test the capabilities of Herschel in detail, frequently with difficult and challenging observations. This allowed astronomers to test their observing strategy, compare data quality with expectations and fine-tune their observing programmes, as well as allowing a global overview to be obtained of the performance of the three instruments.
Observations were carried out on a shared-risk basis: astronomers could opt to forego their proprietary rights on data and allow them to be made public at the opening of the Herschel science archive and, in return, would get the time used re-imbursed in their programmes by Herschel; alternatively, they could maintain the data proprietary for one year from execution and have the data counted as part of their Routine Science programme. So, in return for assuming part of the risk of testing observing modes early in the mission, astronomers had the chance to obtain early publication of Herschel data, selecting their most critical observations for rapid execution.
Figure 1.13. The browse product for the first SDP observation made by Herschel. This is OBSID 1342183677 of the QSO RXCJ0658.5-5556, made for SDP_eegami_3, a 6631 second exposure starting at 02:51:12UT on September 12th 2009 in SPIRE large map mode. This is an RGB image with the SPIRE 500 micron channel as the red layer, 350 microns as green and 250 microns as blue.
Science Demonstration Phase demonstrated that the main mapping modes that are the workhorses of Herschel, particularly in its early mission phases, were essentially ready to go, although some extremely useful input was obtained for observing strategies, leading to the recommendations on how to obtain the best sensitivity in observations. Similarly, it gave a lot of valuable information on how best to define spectroscopic observing modes. Early results from Science Demonstration Phase were presented at the Herschel "Initial Results" Workshop at Madrid in December 2009 at which every single Herschel observing project approved by HOTAC (42 Key Programmes) had some observational data to present.
The prime period for SDP was defined to be from 15 September to 15 December 2009. Those SDP observations that could not be completed by 15 December because of target visibility concerns, or because the required observing mode had not been released, were given the highest priority for telescope scheduling over the period up to 30 April 2010. After this date, the few remaining SDP observations that had not been scheduled for whatever reason, reverted to being treated as Routine Science observations.
As Commissioning and PV activities were advanced with respect to expectations, the first Science Demonstration Phase observations were executed even before the official start of the prime SDP period. OD-121 was entirely dedicated to SDP observations requiring SPIRE large maps. The first SDP observation to be executed was a SPIRE large scan map of RXCJ0658.5-5556 for SDP_eegami_3 (Figure 1.13), taking 6631 seconds to complete, which started at 02:51:12UT on September 12th 2009. Regular scheduling of SDP observations started on OD-145 (October 5th 2009), from which point blocks of SDP time were placed in the schedule with increasing frequency; from October 14th 2009 (OD-155) the schedule was dominated by SDP observations.
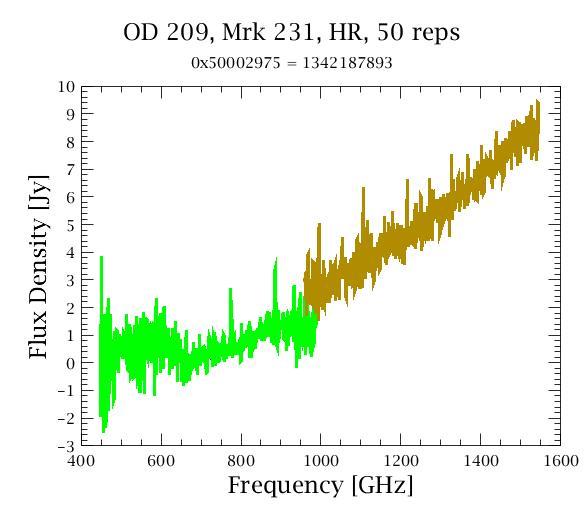
The first day dedicated to PACS Spectroscopy science observations was OD-165 (October 26th 2009). The first PACS spectroscopy observation was OBSID 1342186305, executed starting at 00:17:47UT for SDP_esturm_3, while the first SPIRE spectroscopy science observation was of Mark 231 for SDP_pvanderw_3, OBSID 1342187893 (Figure 1.14), starting at 07:17:14UT on December 9th 2009 (OD209).
After the HIFI anomaly, it was decided to define a variant of SDP for HIFI observers, called the Priority Science Programme, to be executed as rapidly after HIFI recovery as time permitted. HIFI was switched back on on January 21st 2010 (OD-253) and placed in Dissipative II mode (lasers on), with this command being completed successfully at 18:31:31UT, allowing the lasers to stablise for two days of check-out activities on OD-254 and OD-255. Two blocks of five days of intensive re-commissioning and PV were carried out later in January and in February before HIFI science observations could start on February 28th 2010; the first HIFI science observation was a Band Ia observation of NGC 6334, starting at 22:16:18UT for SDP_cceccare_3.
All the initial HIFI observations were taken within the HIFI Priority Science Programme, or PSP. Two blocks of telescope time in March and April 2010 were reserved for intensive HIFI observing campaigns. Observations were divided into PSP1 (highest priority) and PSP2 (second priority) to fill these blocks of time efficiently, allowing a substantial part of the Herschel's HIFI observations to be carried out at the earliest possible date, after which HIFI would enter the standard Mission Planning cycle with a set number of days assigned each 4 weeks. Top priority, when HIFI re-entered the standard Mission Planning cycle was given to scheduling remaining PSP observations. A special HIFI initial results workshop was arranged in Leiden in April 2010 to present a first look at PSP data and checkpoint for observing strategies.
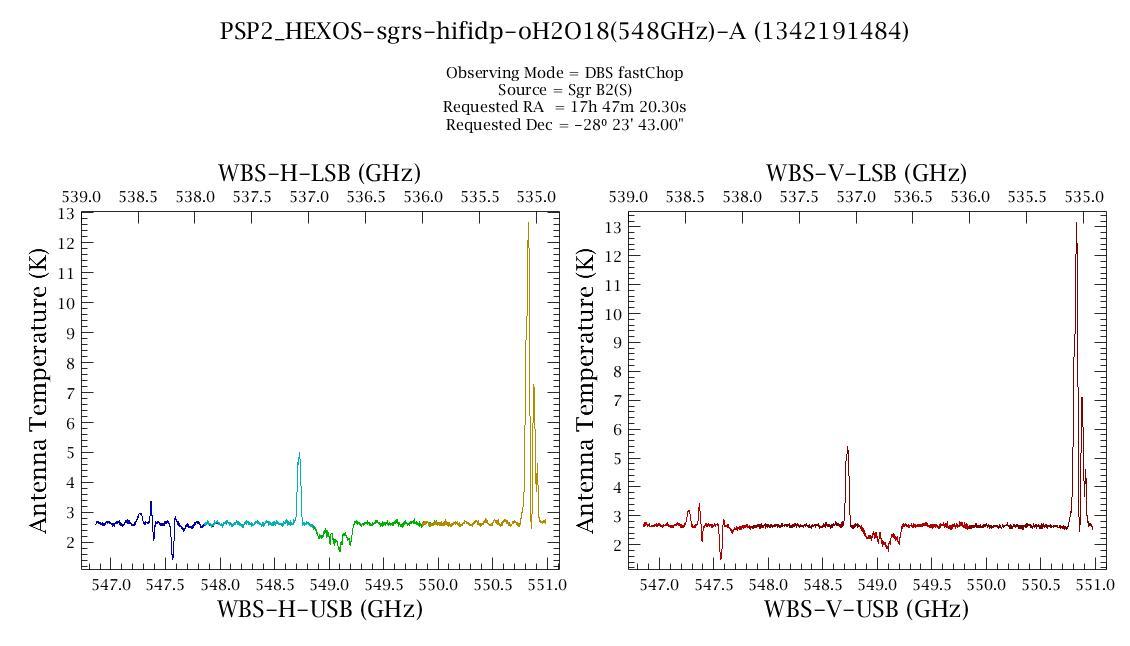
Figure 1.15. The browse product for one of the first HIFI science observations made by Herschel on the first day of the HIFI PSP programme (actually the 4th HIFI observation of PSP). This is OBSID 1342191484 of Sgr B2, made for KPGT_ebergin_1, a 61 second exposure starting at 06:29:20UT on March 1st 2010.