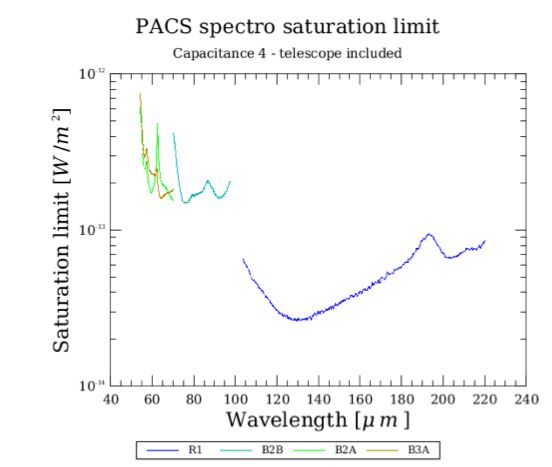
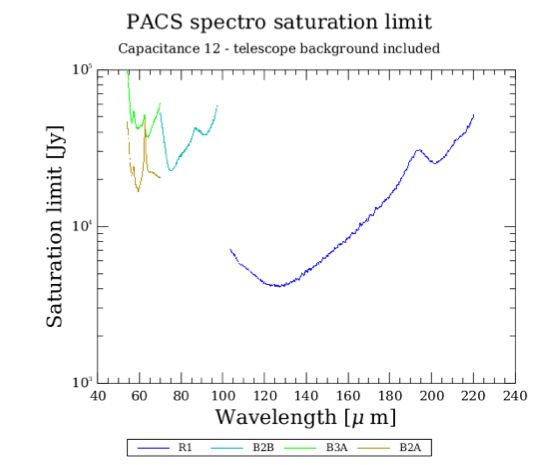
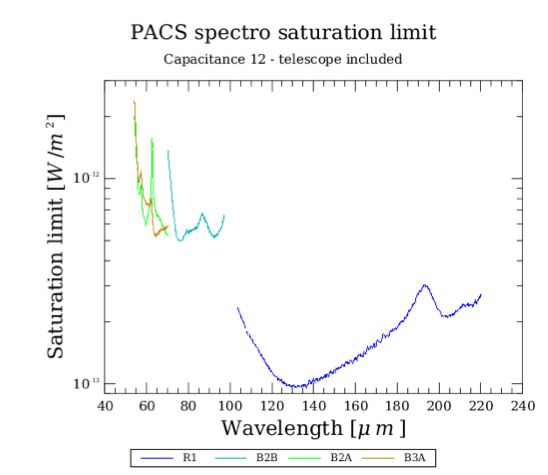
The PACS spectrometer gives access to a large dynamic range in flux densities by selecting 4 different integrating capacitances. The uplink logic automatically selects the integrating capacitance based on estimated continuum and line fluxes. Figure 4.36 shows the saturation limit in Jansky for the default integration capacitance. This is the limit for continuum and peak line flux together. Figure 4.37 shows the default capacitance saturation limits for unresolved lines on a zero continuum. Both figures should allow to judge if the observation can be executed with the default integration capacitance. If continuum and expected line fluxes are higher than the saturation limits for the default capacitance, it is mandatory to enter the expected continuum and line flux for every range at the time the observation is designed and filled in HSpot. Figures Figure 4.38 to Figure 4.41 show the flux limits at which a larger integrating capacitance is selected. If an observation contains lines that fall in different flux regimes, the largest capacitance will be chosen for the entire observation. If lines in the same observation fall in different flux regimes, it is recommended to split the observation into seperate observations per flux regime. Figure Figure 4.42 and Figure 4.43 show the saturation limits using the largest integrating capacitance. If the expected line flux and continuum flux are higher than these limits then detectors may run into saturation and flux calibration becomes unreliable.
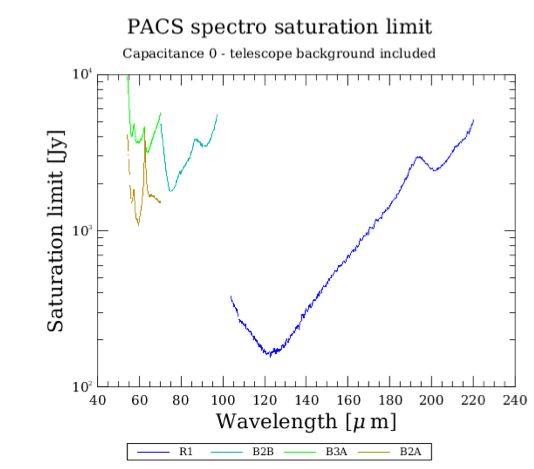
Figure 4.36. Saturation limit with the (default) smallest (~0.14 pF) integrating capacitance (including 80% safety margin).
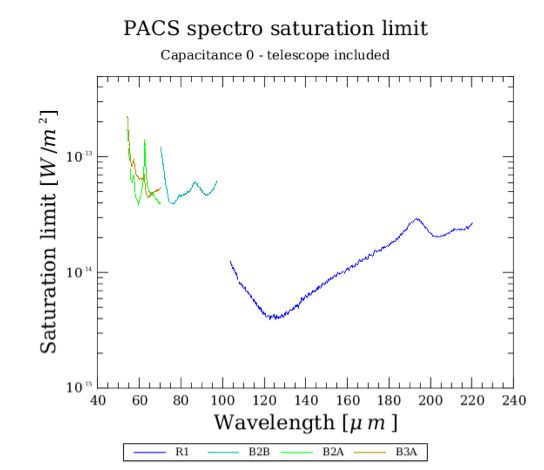
Figure 4.37. Saturation limit for unresolved lines on a zero continuum for the (default) smallest (~0.14 pF) integration capacitance.
Figure 4.38. Saturation limit for the second (~0.24 pF) integration capacitance (including 80% safety margin)
Figure 4.39. Saturation limit for unresolved lines on a zero continuum for the second (~0.24 pF) integrating capacitance (inc. 80% safety margin).
Figure 4.40. Saturation limit for the third (~0.46 pF) integrating capacitance (inc. 80% safety margin).