Table of Contents
This section will deal with "space environment" aspects of the mission that affect the noise level and therefore the observatory sensitivity. These include:
Background, including the telescope, instruments and the celestial background
Radiation environment (high-energy particles)
Source confusion (CFIRB and cirrus spatial structure, resolved or partially resolved galaxies)
Straylight due to sources inside or outside the FoV and to instrumental self-emission
The Herschel telescope is located outside the cryostat and protected by the sunshade from direct radiation from the Sun. The currently measured telescope temperature is in the range 83-89 K and shows an annual variation due to the changing heliocentric distance of the Earth and thus L2 (see below). At this temperature, even given a low emissivity, the source contribution is almost always only a small fraction of the telescope background. For comparison, the telescope background ‘flux’ is of the order of 1000 Jy, while that of Uranus is ∼ 250 Jy and Neptune ∼ 100 Jy. Therefore, a precise characterisation of its behaviour is of critical importance.
The telescope background depends primarily on:
The average temperature: Figure 4.1 shows the temperature of Herschel's telescope mirrors (primary and secondary) measured across 270 ODs (from 1st July, 2009 to 30th March, 2010). The data gathered so far indicate that the temperature is some 5K higher than predicted pre-launch (this is compensated by the lower telescope emissivity, see below). On the other hand, the overall trend, characterised by a monotonic temperature increase with a maximum amplitude of some 6K, is well correlated with the 'seasonal' temperature evolution mode.
The effective emissivity: beyond 100μm, this has a stronger influence on the telescope background level than the temperature. It has been observed that a 1% reduction in emissivity gives a greater improvement than a 5 K reduction in temperature. The predicted (modelled) telescope emissivity was < 0.4%/0.8% (for clean/dusty samples; Fischer et al., 2004 [RD11]). Preliminary results from PACS photometer observations suggest that the actual telescope emissivity is quite significantly lower (about half the predicted figure; Okumura, priv. comm.)
The straylight (see Section 4.4, “Straylight”).
Figure 4.1. Temperatures of the primary mirror (M1), secondary mirror (M2) and cryostat vacumm vessel (CVV) measured from OD50 to OD351. The monotonic increase of temperature from up to OD300 is well correlated to the seasonal temperature variation model.
Small spatial and temporal temperature gradients are important to the background stability. The requirements on the primary mirror (M1) are:
Maximum temperature difference along the S/C Z axis < 10 K (predicted < 0.5 K)
Maximum temperature difference along the S/C Y axis < 1 K (predicted ∼ 0.0 K)
Along the S/C Z axis: dT/dt < 13.0 mK/min
Along the S/C Y axis: dT/dt < 1.3 mK/min
See "Self-emission" under Section 4.4, “Straylight”
Thermal emission from interstellar dust (known as interstellar cirrus) dominates the FIR Sky Background (FIRSB) at lower Galactic latitudes, while the Cosmic Far-Infrared Background (CFIRB) is more significant towards higher Galactic latitudes, also dominating the confusion noise in the PACS and SPIRE photometric bands. Intrinsically diffuse and unresolved components of the FIRSB are (in descending order of their relative contribution, see [RD4] and [RD5]):
Diffuse galactic light (interstellar cirrus): quasi-thermal emission of dust in low density gas clouds in the Milky Way. This is the dominant component for wavelengths λ>70μm.
Zodiacal light and emission from the asteroid belt: this is the dominant component of the sky background at MIR wavelengths.
Cosmic far-infrared background (CFIRB): accumulated and unresolved light of distant galaxies.
The cosmic microwave background (CMB): the CMB also has an important contribution in strength, but the fluctuation amplitudes are small, and well below the detection limits of PACS and SPIRE.
Intergalactic diffuse emission
Integrated starlight: the integrated contribution from faint stars in the Milky Way is an important component for near- to mid-infrared wavelengths, but has a negligible contribution for longer wavelengths, e.g. those of PACS and SPIRE.
A detailed description of the different components of the FIR background is given in the Herschel Confusion Noise Estimator (HCNE) tool Science Implementation Document ([RD4] and [RD5]). The HCNE tool can be accessed as a standalone service to provide background estimates (see the HSC website for more information) or through the HSpot proposal preparation tool.
While the zodiacal light emission is a major contributor to the sky brightness in the MIR range, it is less important for the FIR and sub-mm wavelengths. Moreover, this emission is quite smooth, lacking fluctuations at arcmin scale (angular resolution of the ISOPHOT instrument on board ISO). Smaller scale fluctuations, in principle, are likely to exist, but the presence of such structures have not been yet confirmed by the recent observations of the Spitzer Space Telescope.
Confusion noise due to the integrated FIR-sub-mm emission from faint asteroids individually below the detection limit has been investigated by Kiss et al. (2006) (see [RD5] and references therein). It has been found that the distribution of asteroids concentrates towards the local anti-solar direction, with a corresponding peak of the confusion noise in the anti-solar point, and an extended cloud is present around the maximum. Seasonal variations are also detected. The confusion noise induced by the cloud of asteroids would only be not negligible in the area around the anti-solar direction, but this area of the sky is closed to Herschel anyway due to the satellite's Sun constraint (see Section 2.3, “Sky visibility”), so the asteroid cloud component is not considered in the HCNE.
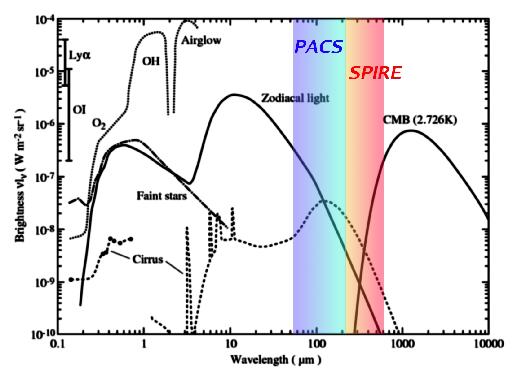
Figure 4.2. Brightness of the night sky, excluding contribution of the extragalactic background (from [RD5], adapted from Leinert et al. 1998, A&A, 127, 1). The spectral range covered by the PACS and SPIRE instruments of the Herschel Space Observatory are indicated. Atmospheric contributors, affecting ground-based observation in the optical and NIR, have been also displayed.
The interstellar medium shows a strong concentration around the Galactic plane; this feature is conspicuous at many wavelengths. However, the cirrus emission is not limited to low Galactic latitudes. It consists of thermal emission of dust in low-density, cool interstellar HI clouds (typically with T≈20K and n≤102cm-3), showing a smooth, modified blackbody SED. It is a strong source of emission, and dominates the sky for wavelengths λ>70μm, even at high Galactic latitudes. The cirrus emission is highly structured, and shows a typical filamentary structure.
The main characteristic of the cirrus emission is its spatial structure at a specific wavelength. This is usually described by the spectral index, α,of the power spectrum of the image, averaged over annuli ([RD7]). With this parameter the power spectrum is P=Po(f / fo)α, where P is the power at the spatial frequency f and Po is the power at the spatial frequency fo. Due to this parameterisation the structure of cirrus is equivalent to that of a fractal.
According to [RD5], cirrus confusion noise can be generally described by the following equation:
σcirrus = c1 × (λ/D)1-α/2 × Bη
Here σcirrus is the confusion noise due to the cirrus component, B is the surface brightness of the field α is the spectral index of the logarithmic power spectrum, averaged in annuli (see [RD5] and references therein), λ is the wavelength of the observation and D is the effective diameter of the telescope's primary mirror. The parameters c1 and η have to be determined from measurements. This is used within the HCNE to compute the noise due to cirrus emission. Details on the computations are given in [RD5].
In many practical cases, Galactic cirrus confusion noise has been found to be easily parameterised as follows (see for instance [RD6] and references therein):
σcirrus ∼ 0.3(λ100)2(Dm)-2.5⟨Bλ⟩1.5
where σcirrus is given in mJy, λ100 is the wavelength ratio λ/(100 μm), Dm is the telescope diameter in metres and ⟨Bλ⟩ is the sky brightness in MJy/sr. If we consider fiducial values ⟨B70⟩ = 0.12 MJy/sr and ⟨B160⟩ = 1.5 MJy/sr (corresponding to NHI = 1020 cm-2) and Dm = 3.5, we get that σcirrus(70 μm) = 0.22 μJy and σcirrus(160 μm) = 0.08 mJy.