The L2 environment (and orbits around it) is relatively benign compared to those in geostationary (GO), or low Earth (LEO) orbits. In particular, a series of common threats for satellites in GO or LEO, including the neutral thermosphere, space debris, geomagnetically trapped particles and large temperature gradients, are not a concern for L2 orbits. Environmental aspects to be considered at L2 include:
Solar wind plasma. Essentially a neutral or cold plasma: 95% protons, 5% He++ and equivalent electrons; 1-10 particles/cm3. The main risk associated is a low surface charging potential. This plasma may be relatively benign at L2 compared to that found at GO and LEO.
Ionising radiation: solar flares (energetic electrons, protons and alpha particles), Galactic cosmic rays and Jovian electrons.
Magnetic fields: Earth's magnetotail extends up to 1000 Earth's radii, so it must be considered (2-10 nT) along with interplanetary magnetic field (∼ 5 nT). The effects on the spacecraft and PLM include possible orbit disturbance and electrostatic discharge (ESD).
Therefore, the main radiation components at L2 consist of: Galactic cosmic rays, solar particle events and solar and Jovian electrons. Solar activity follows an 11-year cycle. The last minimum occurred in December 2008 and therefore the Herschel launch in 2009 was carried out during a low activity state. Contrary to former predictions, the next solar cycle will be below average in intensity, with a predicted maximum sunspot number of 90. Given the predicted date of solar minimum and the predicted maximum intensity, solar maximum is now expected to occur in May, 2013 (Solar Cycle 24 Prediction Panel agreement on May 8, 2009). Therefore Solar particle events are expected to be problematic only towards the end of the mission.
In the early stages of the mission, the dominant radiation source will be Jovian electrons, characterised by a energetic population and a 13-month synodic year modulation. Solar electrons will be an important source at lower energies with abrupt peak emissions, and a 27-day period.
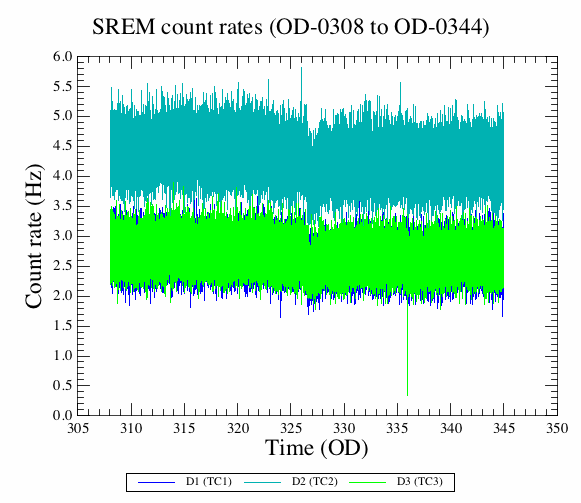
The Herschel spacecraft is equipped with a standard radiation environment monitor (SREM) placed in the -Z SVM panel; the SREM is a particle detector developed for satellite applications that has been added to Herschel and Planck as a passenger. It measures high-energy electrons (from 0.5 MeV to infinity) and protons (from 20 MeV to infinity) of the space environment with an angular resolution of some 20 degrees, providing particle species and spectral information. The SREM data are received on-ground and processed by the Space Weather Group at ESTEC, providing valuable information on the radiation environment at L2. A sample plot showing the calibrated count rates in three counters (TC1 - protons with E > 20 MeV; TC2 - protons with E > 39 MeV; TC3 - electrons with E > 0.5 MeV) is displayed in Figure 4.3 .
