This section will deal with "space environment" aspects affecting the noise level and therefore the observatory sensitivity. These include:
Background, including the telescope, instruments and the celestial background
Radiation environment (high-energy particles)
Source confusion (CFIRB and cirrus spatial structure, resolved or partially resolved galaxies)
Straylight due to sources inside or outside the FoV and to instrumental self-emission
The Herschel telescope is located outside the cryostat and protected by the sunshade from direct radiation from the Sun. The expected orbital temperature is below 80 K. At this temperature and even given a low emissivity, the source contribution is almost always a small fraction of the telescope background. Therefore, a precise characterisation of its behaviour is of critical importance.
The telescope background depends primarily on:
The average temperature: The telescope temperature will be in the 60-90 K range, but the actual value will only be known in space. Efforts are being made to lower the value and to narrow the range of uncertainly as much as possible. The telescope temperature depends critically on the temperatures and emissivities of the thermal interfaces, the sunshade/shield and the CVV topside.
The effective emissivity: beyond 100μm, it has a stronger influence on the telescope background level than the temperature. As shown Figure 11 shows, a 1% reduction in emissivity gives a greater improvement than a 5 K reduction in temperature.
The straylight (see Section 5.4, “Straylight”).
Small spatial and temporal temperature gradients are important to the background stability. The requirements for gradients on the primary mirror (M1) are:
dT/dz < 10 K (predicted < 0.5 K)
dT/dy < 1 K (predicted ∼ 0.0 K)
Along z: dT/dt < 13.0 mK/min
Along y: dT/dt < 1.3 mK/min
See "Self-emission" under Section 5.4, “Straylight”
Thermal emission from interstellar dust (known as interstellar cirrus) dominates the FIR Sky Background (FIRSB) at lower galactic latitudes, while the Cosmic Far-Infrared Background (CFIRB) is more significant towards higher Galactic latitudes, also dominating the confusion noise in the PACS and SPIRE photometric bands. Intrinsically diffuse and unresolved components of the FIRSB are (in descending order of their relative contribution, see [RD4] and [RD5]):
Diffuse galactic light (interstellar cirrus): quasi-thermal emission of dust in weak gas clouds in the Milky Way. This is the dominant component for wavelengths λ>70μm.
Zodiacal light and emission from the asteroid belt: this is the dominant component of the sky background at MIR wavelengths.
Cosmic far-infrared background (CFIRB): accumulated and unresolved light of distant galaxies.
The cosmic microwave background (CMB): the CMB also has an important contribution in strength, but the fluctuation amplitudes are small, and well below the detection limits of PACS and SPIRE.
Intergalactic diffuse emission
Integrated starlight: the integrated contribution from faint stars in the Milky Way is an important component for near- to mid-infrared wavelengths, but has a negligible contribution for longer wavelengths, e.g. those of PACS and SPIRE.
A detailed description of the different components of the FIR background is given in the Herschel Confusion Noise Estimator (HCNE) tool Science Implementation Document ([RD4] and [RD5]).
While the zodiacal light emission is a major contributor to the sky brightness in the MIR range, it is less important for the FIR and sub-mm wavelengths. Moreover, this emission is quite smooth, lacking fluctuations at arcmin scale (angular resolution of the ISOPHOT instrument on board ISO). Smaller scale fluctuations, in principle, are likely to exist, but the presence of such structures have not been yet confirmed by the recent observations of the Spitzer Space Telescope. Therefore, the zodiacal light component is currently not included in the HCNE.
Confusion noise due to the integrated FIR-sub-mm emission from faint asteroids individually below the detection limit has been investigated by Kiss et al. (2006) (see [RD5] and references therein). It has been found that the distribution of asteroids concentrates towards the local anti-solar direction, with a corresponding peak of the confusion noise in the anti-solar point, and an extended cloud is present around the maximum. On the other hand, seasonal variations are detected. For the Herschel observatory, confusion noise induced by the cloud of asteroids would be not negligible in the area around the anti-solar direction. Nevertheless, due to the satellite Sun constraint (see Section 2.3, “Sky visibility”) the telescope is not allowed to point towards opposition targets, and therefore the asteroid cloud component is not considered in the HCNE.
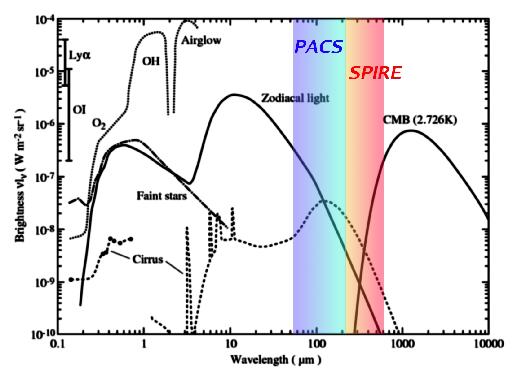
Figure 12. Brightness of the night sky as seen from the ground, without the contribution of the extragalactic background (from [RD5], adapted from Leinert et al. 1998, A&A, 127, 1). The spectral range covered by the PACS and SPIRE instruments of the Herschel Space Observatory are indicated.
The interstellar medium shows a strong concentration around the Galactic plane; this feature is conspicuous at many wavelengths. However, the cirrus emission is not limited to low Galactic latitudes. It consists of thermal emission of dust in low-density, cool interstellar HI clouds (typically n≤102cm-3 and T≈20K), showing a smooth, modified blackbody SED. It is a strong source of emission, and dominates the sky for wavelengths λ>70μm, even at high Galactic latitudes. The cirrus emission is highly structured, and shows a typical filamentary structure.
The main characteristic of the cirrus emission is its spatial structure at a specific wavelength. This is usually described by the spectral index, α,of the power spectrum of the image, averaged over annuli ([RD7]). With this parameter the power spectrum is P=Po(f / fo)α, where P is the power at the spatial frequency f and Po is the power at the spatial frequency fo. Due to this parameterisation the structure of cirrus is equivalent to that of a fractal.
According to [RD5], cirrus confusion noise can be generally described by the following equation:
σcirrus = c1 × (λ/D)1-α/2 × Bη
Here σcirrus is the confusion noise due to the cirrus component, B is the surface brightness of the field α is the spectral index of the logarithmic power spectrum, averaged in annuli (see [RD5] and references therein), λ is the wavelength of the observation and D is the effective diameter of the telescope's primary mirror. The parameters c1 and η have to be determined from measurements. This is used within the HCNE to compute the noise due to cirrus emission. Details on the computations are given in [RD5].
In many practical cases, galactic cirrus confusion noise has been found to be easily parameterised as follows (see for instance [RD6] and references therein):
σcirrus ∼ 0.3(λ100)2(Dm)-2.5⟨Bλ⟩1.5
where σcirrus is given in mJy, λ100 is the wavelength ratio λ/(100 μm), Dm is the telescope diameter in metres and ⟨Bλ⟩ is the sky brightness in MJy/sr. If we consider fiducial values ⟨B70⟩ = 0.12 MJy/sr and ⟨B160⟩ = 1.5 MJy/sr (corresponding to NHI = 1020 cm-2) and Dm = 3.5, we get that σcirrus(70 μm) = 0.22 μJy and σcirrus(160 μm) = 0.08 mJy.
The L2 environment (and orbits around it) is relative benign compared to those in geostationary (GO), or low Earth (LEO) orbits. In particular, a series of common threats for satellites in GO or LEO, including the neutral thermosphere, space debris, geomagnetically trapped particles and large temperature gradients, are not a concern for L2 orbits. Environmental aspects to be considered at L2 include:
Solar wind plasma. Essentially a neutral or cold plasma: 95% protons, 5% He++ and equivalent electrons; 1-10 particles/cm3. The main risk associated is a low surface charging potential. This plasma may be relatively benign at L2 compared to that found at GO and LEO.
Ionising radiation: solar flares (energetic electrons, protons and alpha particles), Galactic cosmic rays and Jovian electrons.
Magnetic fields: Earth's magnetotail extends up to 1000 Earth's radii, so it must be considered (2-10 nT) along with interplanetary magnetic field (∼ 5 nT). The effects on the spacecraft and PLM include possible orbit disturbance and electrostatic discharge (ESD).
Therefore, the main radiation components at L2 consist of: Galactic cosmic rays, solar particle events and solar and Jovian electrons. Solar activity follows a 11-year cycle. The last minimum occurred around March, 2006, and therefore the Herschel launch in 2008 will be carried out during a low to moderate activity state. Therefore a small number of major solar particle events is expected during the earliest mission stages. The activity will increase towards the end of the nominal mission, 3.5 years later. The number of damaging solar particle events increase dramatically due to the new solar maximum in 2011, which is predicted to be an unusually strong one. Solar particle events will be particularly problematic during a possible extended mission.
In the early stages of the mission, the dominant radiation source will be Jovian electrons, characterised by a energetic population and a 13-month synodic year modulation. Solar electrons will be an important source at lower energies with abrupt peak emissions, and a 27-day period.
Source confusion is an additional noise factor closely related to the astronomical background, described in Section 5.1, “Background radiation”. The sensitivity limit due to confusion is determined by the telescope aperture, observation wavelength and the position on the sky. The sensitivity cannot be improved by increasing the integration time after reaching the confusion limit. The most important contributions to source confusion are:
Structure of the CFIRB, as well as resolved and partially resolved extragalactic sources dominate at high galactic latitudes.
Small-scale structure in cirrus clouds may dominate at intermediate Galactic latitudes. The contribution depends heavily on the level of cirrus emission at the position on the sky.
The confusion noise is usually defined as the (stochastic) fluctuations of the background sky brightness below which sources cannot be detected individually. In addition to the diffuse galactic foreground cirrus component, these fluctuations are caused by intrinsically discrete extragalactic sources in the beam. Due to the limited telescope diameter compared to the wavelength, these fluctuations play an important, if not dominant, role in the total noise budget in extragalactic surveys carried out in the MIR, FIR, sub-mm and centimetre range. Moreover, the noise due to extragalactic sources depends strongly on the shape of the source counts at a given wavelength.
There are two different criteria to derive the confusion noise, and thus the detectability of a point-like or compact source:
First, the target source flux should be well above the average background fluctuation amplitude. This is the basis of the "photometric criterion", derived from the fluctuations of the signal due to sources below the detection threshold Slim in the beam.
On the other hand, the observed source should be far enough from its neighbours to be properly separated; this is the basis of the "source density criterion", which is derived from a completeness criterion and evaluates the density of the sources above the detection threshold Slim, such that only a small fraction of the sources are missed because they cannot be separated from the nearest neighbour.
Generally, we should compare the confusion noise derived from both criteria, in order not to underestimate it artificially. The confusion noise, σc, and confusion limit, Slim are defined as follows:
σc² = ∫ƒ²(θ,φ)dθdφ∫0S_limS²(dN/dS)dS
where ƒ(θ,φ) is the instrumental 2D beam profile, that can be approximated by a Gaussian profile with the same FWHM as the expected PSF, or by an Airy function, S is the source flux density (in Jy) and dN/dS is the differential source number counts (in Jy-1sr-1).
Then, the total noise is computed by square-adding the different noise contributions, in this case the photon (and instrumental) noise and the confusion noise, i.e. σtotal = (σp2 + σc2)½
The photometric criterion is defined by choosing the S/N ratio qphot between the faintest source (of flux Slim and the noise σc due to fluctuations from beam to beam caused by sources fainter than Slim, as given by the implicit equation:
qphot = Slim / σc(Slim)
q is usually chosen between 3 and 5, depending on the specific objectives.
The source density criterion is defined by setting the minimum degree of completeness of the detection of sources above the limiting flux Slim, which is driven by the fraction of sources lost in the detection process due to a nearest neighbour source with flux above Slim too close to be separated given an instrumental beam size. For a given Poissonian source density N(>S), the probability P of finding a nearest neighbour with S ≥ Slim at a distance closer than the minimum angular separation θmin is given by:
P(< θmin) = 1 - exp(-πNθ²min)
An acceptable probability limit is Pmax = 0.1. The minimum distance is usually parameterised using the FWHM of the beam profile θmin = kθFWHM, and 0.8 ≤ k ≤ 1. Fixing the probability we obtain the corresponding "source density criterion" limiting density of sources:
NSDC = -ln(1-P(<θmin)) / πNk²θ²FWHM
The instrumental beam area, is given by Ω ∼ 1.14θ²FWHM. Therefore, for P = 0.1 and k = 0.8, the density is 1/16.7 sources/beam. The limiting source flux, SSDC is thus determined by using existing number counts results and a suitable model for infrared galaxy evolution extrapolating the data to the appropriate wavelengths and (faint) flux levels. The confusion noise, σSDC is computed using the same relation as for the photometric criterion, as the S/N ratio qSDC = SSDC / σSDC.
The Herschel confusion noise predicted data shown in Table 7 have been derived by Lagache et al. 2003 ([RD8]) using number counts derived from a phenomenological model based on template spectra of starburst and normal galaxies, and on the local infrared luminosity function. This model has been found to be in very good overall agreement with ISOCAM at 15 μm, IRAS at 60 and 170 μm and SCUBA at 850 μm (see references within [RD8]). Confusion level predictions for Herschel/PACS have been also computed by Dole et al. 2004 ([RD9]) based on recent Spitzer/MIPS number counts from Papovich et al. 2004 ([RD10]) shown in Figure 13. They obtain SSDC(70 μm) = 0.16 mJy and SSDC(160 μm) = 10.0 mJy.
Table 7. PACS and SPIRE confusion noise according to photometric and source density criteria. From [RD9]. It can be seen that for PACS and SPIRE's shortest wavelength, source density is the applicable criterion, while for SPIRE at longer wavelengths, the photometric criterion produces more realistic estimates.
| σ (mJy) | Slim (mJy) | ||
|---|---|---|---|
| PACS 75 μm | qphot = 5.0 | 2.26 × 10⁻³ | 1.12 × 10⁻² |
| qSDC = 8.9 | 1.42 × 10⁻² | 1.26 × 10⁻¹ | |
| PACS 110 μm | qphot = 5.0 | 1.98 × 10⁻² | 1.0 × 10⁻¹ |
| qSDC = 8.7 | 1.02 × 10⁻¹ | 8.91 × 10⁻¹ | |
| PACS 170 μm | qphot = 5.0 | 3.97 × 10⁻¹ | 2.00 |
| qSDC = 7.13 | 9.93 × 10⁻¹ | 7.08 | |
| SPIRE 250 μm | qphot = 5.0 | 2.51 | 12.6 |
| qSDC = 5.2 | 2.70 | 14.1 | |
| SPIRE 360 μm | qphot = 5.0 | 4.4 | 22.4 |
| qSDC = 3.6 | 3.52 | 12.6 | |
| SPIRE 550 μm | qphot = 5.0 | 3.69 | 17.8 |
| qSDC = 2.5 | 3.18 | 7.94 |

Figure 13. Cumulative (left) and differential (right) 24 μm number counts from [RD10]. The differential counts have been normalised to an Euclidean slope, dN/dSν ∼ Sν-2.5. The curves show predictions from different recent models, including that from Lagache et al. 2003.
With regard to straylight, the Herschel design has been carried out including the instrument optical layout. This approach allows the level of straylight that originates from the various sources at detector level to be provided directly. Therefore, the straylight requirements are given directly as the straylight reaching the detector. The following apply over the full operational wavelength range:
Scattered light from sources outside the telescope FoV: Taking into account the worst possible combination of the positions of the Moon and the Earth w.r.t. the line of sight (LoS) of the telescope, the extreme values are:
The straylight shall be < 1% of background radiation induced by the self-emission of the telescope.Sun-S/C-Earth angle of 37°
Sun-S/C-Moon angle of 47°
Sun-S/C-LoS angle of 60° to 120° (in the S/C XZ plane)
Maximum roll angle of ±1°
Sources inside the FoV: over the entire FoV at angular distances ≥ 3 arcmin from the peak of the point-spread-function (PSF), the straylight shall be < 1 × 10⁻⁴ of PSF peak irradiance (in addition to level given by diffraction).
Self-emission: The straylight level, received at the defined detector element location of the PLM/Focal Plane Unit Straylight model by self emission (with "cold" stops in front of PACS and SPIRE instrument detectors), not including the self emission of the telescope reflectors alone, shall be < 10% of the background induced by self-emission of the telescope reflectors.
According to current straylight analysis for the orbit configuration of Herschel (see [RD3]), for sources outside the FoV, the straylight radiation is within specification, except for small locations on the sky, where radiation reflected from rectangular hexapod structures can enter the instruments directly. These small locations exist primarily for the Moon. Only two minor paths were found which could be applicable also to the Earth. For the worst-case locations of the Moon, the specification is exceeded by a factor 16.4.
For sources inside the FoV, the requirement is met by a wide margin.
Finally, for thermal self-emission, the requirement is not met. Actual values are:
30% for PACS and 19% for SPIRE (pessimistic case)
12% for PACS and 8% for SPIRE (optimistic case)