The fraction of the Herschel+PACS PSF seen in one spaxel varies with wavelength. In order to recover full beam line fluxes or flux densities for point sources, a wavelength dependent correction factor needs to be applied to the line fluxes or flux densities as measured in the central spaxel only (see Section 4.4). The wavelength dependent fraction between the point source flux seen in the central spaxel and the full beam flux has been modelled and scaled to actual measurements of the PACS spectrometer PSF maps measured on Neptune. The correction curve is depicted in Figure 4.5. This correction curve assumes a point source perfectly centred on the central spaxel. In the current version of the pipeline this curve is not applied, but can be found in the calibration table calTree.spectrometer.pointSourceLoss.
Alternatively, the full flux or flux density of a source can be recovered by co-adding the spectra obtained from several spaxels ("aperture photometry"). In this case, of course, no correction factor needs to be applied. However, if accurate line shapes are to be preserved, at the level of the instrumental resolution or below, it is not recommended to co-add the spectra obtained in different spaxels. As with all slit spectrographs, a different position of the source photocenter in the dispersion direction of the slit induces wavelength shifts and line profile skews (Section 4.7.3). Co-adding line profiles in different spaxels will therefore result in broadened and skewed line shapes. Work on proper optimal extraction and fitting of spectral lines is under way in the PACS ICC.
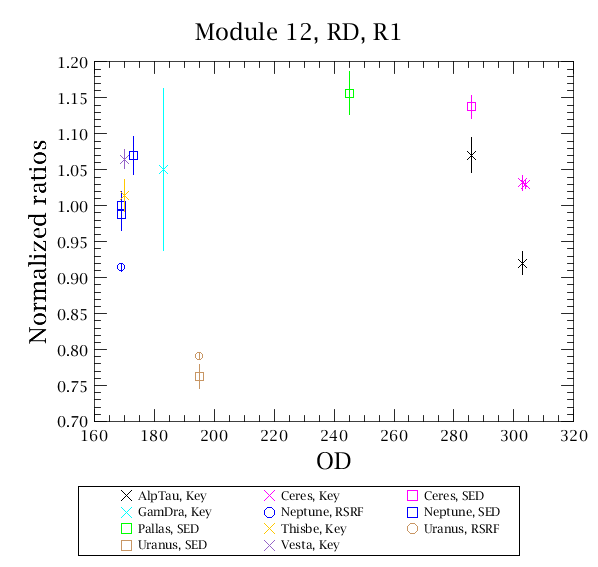
The PACS pipeline uses a flux conversion based on the calibration block performed at the start of every AOR. During the calibration block, the differential signal between the two internal calibration sources is measured at a key wavelength within the spectral order that is being used in the AOR. That signal is known in absolute terms, as it is regularly calibrated on celestial standards, for which we dispose of state of the art models. Figure 4.22 to Figure 4.25 illustrate the comparison between observations calibrated with that strategy and models, for all calibration measurements obtained after the focal plane geometry of the instrument was established. The flux calibration accuracy of the PACS spectra is currently of 30%. Various further improvements are being investigated at the PACS ICC. Nevertheless, a fraction of the inaccuracy is suspected to be related to the pointing of the satellite: it can be shown that the dispersion observed in these figures is significantly reduced when one considers the co-addition of the flux in all spatial pixels instead of just the central one.
Broad spectral features (a few resolution elements) and continuum shape difference of ~10% in the blue bands and~20% in the red band can be introduced by transient effects and features in the relative spectral response function. Corrections for these effects are under study. In the mean time, such features should not be interpreted blindly. A first check is to compare with the shape of the relative spectral response function at the wavelength where the feature is observed.
The same 10% (blue bands) and 20% (red bands) accuracy applies when comparing line fluxes within one spectral band. When comparing line fluxes across different bands, the 30% absolute uncertainty applies on the individual line fluxes.
The accuracies quoted above include the effect of detector response drifts, transients and signal losses due to the pointing accuracy limits.
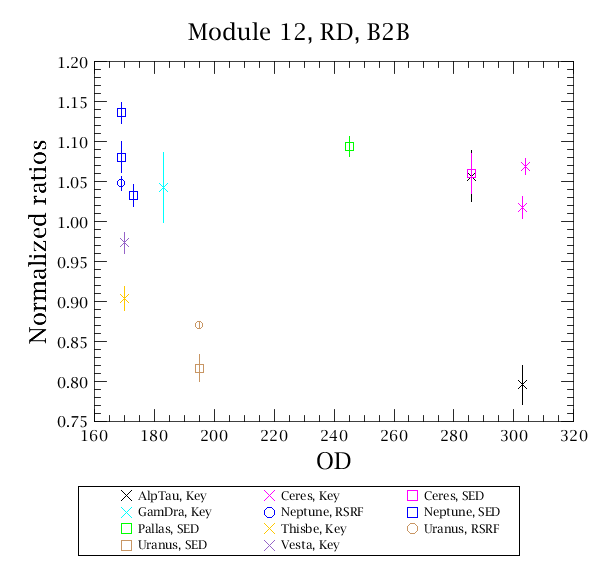
Figure 4.22. Average observed PACS spectrum of sky flux calibrators, corrected with the response derived from the calibration block, divided by model predictions - band B2A.
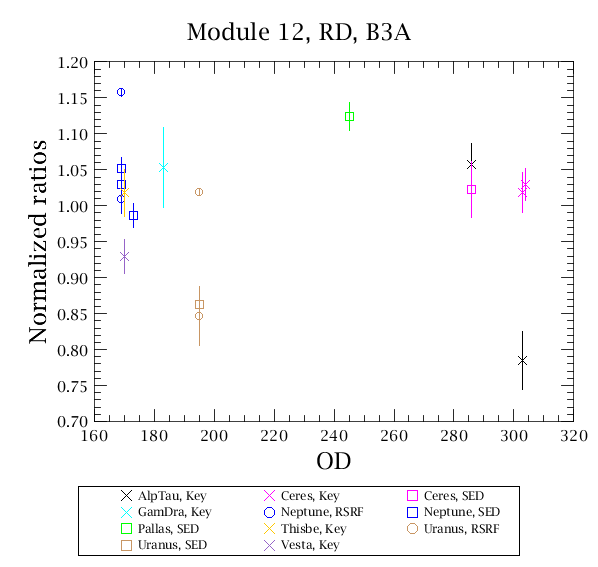
Figure 4.23. Average observed PACS spectrum of sky flux calibrators, corrected with the response derived from the calibration block, divided by model predictions - band B3A.