Herschel offered two types of spectroscopic capability. PACS and SPIRE offered low to intermediate resolution spectroscopy covering the full Herschel wavelength range. HIFI offered high-resolution spectroscopy over the range from 157-625 μm (480-1910 GHz) using heterodyne techniques, although there is a small gap in coverage from 213-240 microns (1272-1430 GHz), between the HIFI 5b and 6a sub-bands: Figure 3.7 shows this gap in coverage, but also illustrates the extraordinary capabilities of HIFI for detecting spectral lines. Users were thus be able to select a wide range of resolutions from Δλ/λ=20 to Δλ/λ=10 000 000 according to the brightness of their source and the science that was required. The main spectroscopic capabilities are summarised in Table 3.2.
The short wavelength cut-off for Herschel is a matter of definition. For PACS the detector sensitivity below 55 microns was too low to be of practical use in most cases and so this value is given as a limit here. However, there is an O III line at 52 microns that is strong enough to observe in some targets. The sensitivity of PACS in the 50-55 micron range was updated in HSpot in Autumn 2011, as the initial values given were found to be too optimistic by a factor of about 3; this correction though made systematic observation at wavelengths shorter than 55 microns even more impractical than originally envisaged.
In its highest resolution mode Herschel offered a velocity resolution as high as 0.3km/s. The wavelength range covered by Herschel has many thousands of lines of water, atomic transitions and organic molecules, as shown by the extraordinary spectrum in Figure 3.7, observed by the KPGT_ebergin_1 Key Programme, in which 75 000 lines have been detected so far, although only some 20 000 have been identified to date. This allowed Herschel to study the chemistry of the interstellar medium, tracing water and organic molecules in molecular clouds. Herschel was also be able to study the chemistry of solar system bodies such as the atmosphere of Mars and the comas of comets in unprecedented detail.
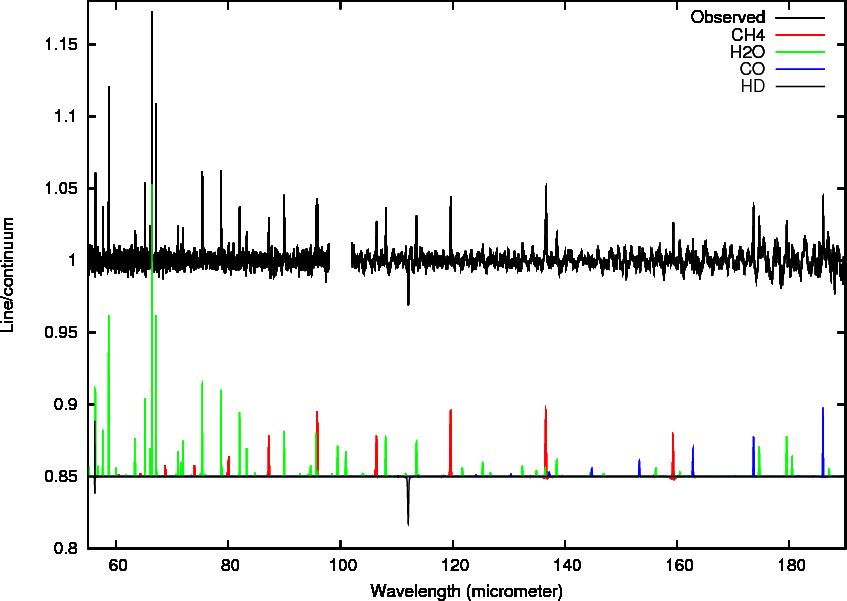
Figure 3.6. A PACS composite spectrum of Neptune from 57 to 190 microns (upper pane) and the corresponding line identifications (lower pane). The spectrum is dominated by water emissions at short wavelengths, with methane, carbon moxide and deuterated hydrogen important above 90 microns. From Lellouch et al.: 2010, A&A, 518, L152
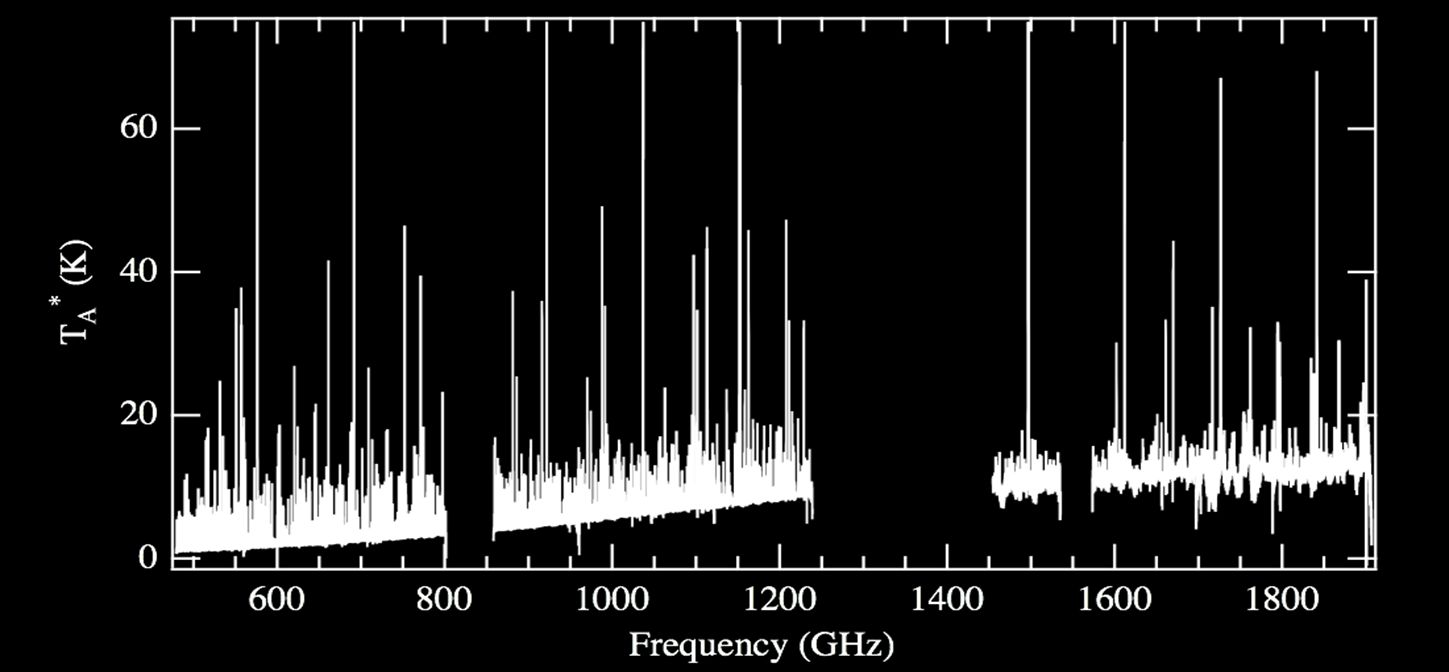
Figure 3.7. A full spectrum scan of Orion KL taken with HIFI for KPGT_ebergin_1. This spectrum shows the extraordinary number of spectral lines visible in this source. A total of 75 000 lines have been detected in the spectrum, only 20 000 of which have been identified so far, of which 5000 are from methanol. The gap in the spectral coverage between bands 5b and 6a is clear in this view with its linear frequency scale.
All three instruments had a mapping capability in spectroscopic mode, even though HIFI's was somewhat limited, although by no means negated, by the fact that its detector had only a single pixel. PACS and HIFI could scan the detectors across the sky, accumulating spectroscopic data along the length of the scan. SPIRE could not do that, instead it used a beam-steering mirror to make filled maps. All three instruments could make a raster map in spectroscopic mode. This allowed a spectroscopic survey to be made either of a region that has been mapped in imaging mode, such as a cluster of galaxies, or across a known extended source such as a molecular cloud.
Table 3.2. The main spectroscopic capabilities of PACS, SPIRE and HIFI. For more details please check the relevant instrument manual.
| PACS | SPIRE | HIFI | |
| Wavelength range | 55-210 μm | 194-313 and 303-671 μm | 157-213 and 240-625 μm (with gap) |
| Field of view | 47x47" | 2.0' (unvignetted) | Single pixel (see below) |
| Pixel size | 9" | 17", 29" (varies across the bands) | 39" (488GHz), 13" (1408GHz) |
| Sensitivity (5σ/1hr, point source) | 2x10-18 Wm-2 (130 μm, 1st order), 5x10-18 (70 μm, 3rd order). Continuum: 100 mJy (1st order), 250 mJy (3rd order) | 1.0-2.2x10⁻¹⁷ Wm-2 (high resolution), 40-88mJy (low resolution) [5 sigma/1 hr] | "A few" mK (Band 1a) to 100mK (Band 7b), 1 sigma/1hr |
| Resolution | 900-2100 (1st order, 102-210 μm), 1800-3000 (2nd order, 72-98 μm), 2600-5400 (3rd order, 55-72 μm) | 20-1000 | 1000-107 |
![[Note]](../../admonitions/note.gif) | Note |
|---|---|
For the latest information on instrument sensitivities please check the Herschel website at http://herschel.esac.esa.int/. Note also that the PACS sensitivity below 57 microns is very low, although HSpot permitted the entry of line observations at wavelengths down to 51 microns. It is a matter of definition where the short wavelength cutoff of PACS is set. Some successful observations of the strong O III line at 51.81 microns were carried out, but only on the brightest available targets. |