HIFI uses dual side-band (DSB) mixers with a large IF (6 GHz) and a large simultaneous spectrometer bandwidth (4 GHz). Spectral features are then likely to have a different gain response depending on whether they are from the upper or lower side-band. The ratio of these gains is referred to as the sideband gain ratio. For equal responses to upper and lower side-band frequencies, the side-band ratio is 1 (or a normalized sideband gain ratio of 0.5). However, gain slopes lead to sideband gain ratios deviating from unity - this is particularly true at some mixer band edges, or IF spectrum edges (where the dual frequencies in the spectrum come from sky frequencies separated by up to 16 GHz)
The side-band ratio can not easily be measured in flight (although checks have been made across the IF band) and was measured in the laboratory prior to flight using gas cell measurements (see [19]). This also requires a full understanding of the molecular gas that was surveyed. A full exploitation of the gas cell measurements of a frequency survey of methanol lines has recently been completed (see [20]).
Specific tests have been carried out in the laboratory and on-orbit since the start of the Herschel mission, to assess the repeatability of spectral lines occurring at different IF frequencies in both upper and lower sidebands. On orbit these tests have been done so far in beam splitter Bands 1b, 2a, and 5a, and diplexer Band 4a, towards NGC7538 IRS 1 using strong CO lines. The frequency was gradually changed so the line was stepped across the band to look for changes in intensity. Figure 5.16, “CO line and IF intensity variation.” shows how this looks in the Band 1b engineering test, with all 15 spectra of the same CO 5-4 line over-plotted in IF frequency in the upper sideband of the WBS-V. Figure 5.17, “Water line and IF intensity variation.” shows a similar example, taken from a different source using a standard Spectral Scan in 1b on the H2O 110 - 101 557 GHz line.
All of the tests were done in DBS mode. The line signal is typically 10-20K and noise less than 0.2K, resulting in a S/N ratio of over 100.
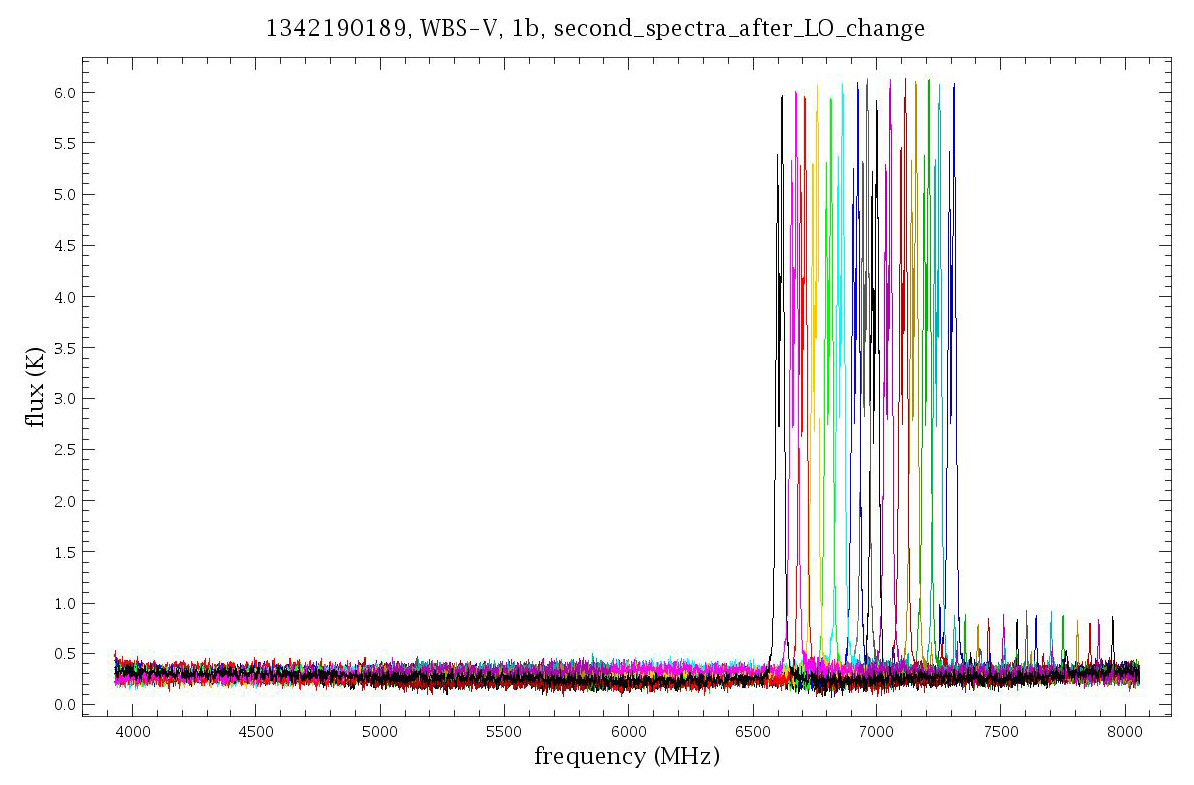
Figure 5.16. CO 5-4 for NGC 7538 IRS 1 with WBS-V, spaced across the upper sideband from an engineering Spectral Scan.
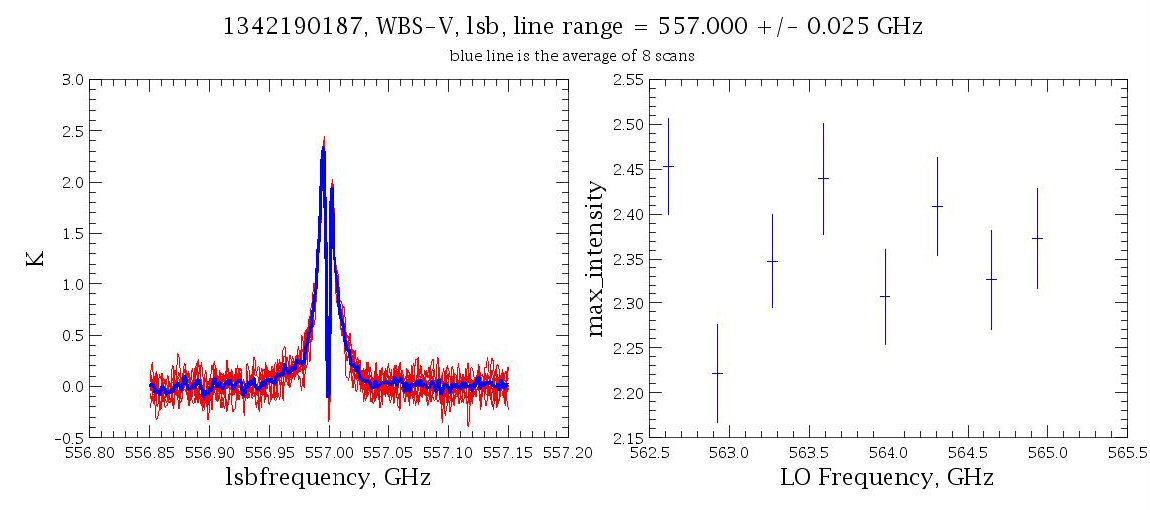
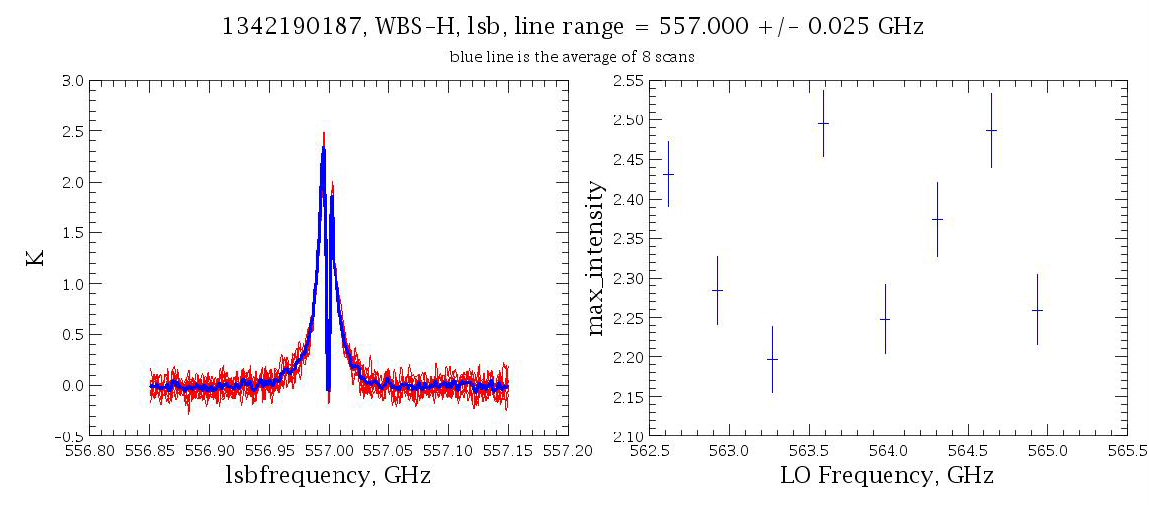
Figure 5.17. Measurements of the 557 GHz water line at 8 positions in the LSB in WBS-V (upper) and WBS-H (lower).
While the comparison between flight data and ground-based gas cell measurements is continuing, the following conclusions are reached for the bands without diplexers:
Band 2a: the integrated line intensities vary by less than 1% around the average value. However there is a strong side-band ratio drop at the lower end of the band (534-564 GHz) due to the less efficient response of the mixer in this range. This drop will be corrected in the calibration tables of HIPE 7.1 onwards.
Band 5a: there is a slight USB/LSB line strength difference (3%). This is true for both polarizations. The (H-V)/H intensity difference is also 3% on average; true for both sidebands. This could be due to pointing offsets between the polarizations.
Similar to band 2a away from the band edges, with noticeable side-band ratio deviation from one in a narrow region around 571 GHz, and at the upper end of the band (> 620 GHz).
For Band 4a, the only diplexer band tested so far, the sideband ratio test was carried out without retuning the diplexer, and then the same test was redone but with retuning. The following conclusions are reached:
The observations without diplexer retuning show that in the unlikely event of a diplexer mistune, the diplexer window significantly affects calibration. At least some of this variation can be eliminated by recalibrating with the ratio of the noise levels at the frequency for which the diplexer is correctly tuned. This should not happen for normal observing.
The Standing Wave test showed no convincing effect -- the variation is less than +/- 2% and this slight variation does not show a 650MHz period like the diplexer standing wave.
With the diplexer retune, and only taking into account the scans preceding the sharp increase in noise level, the CO 9-8 line seen in the LSB is a few SBR effect or rather due to the diplexer. All of the variations seen are greater than identical spectra affected only by random noise at the RMS noise level.
The V polarization is systematically stronger than the H but the line profiles are different, suggesting that at least part of the difference is due to a pointing offset.
The RMS noise was much greater when the CO line was in the LSB (high LO frequency) and this was true for both polarizations.
A summary of these results is represented in Figure 5.18, “Overall IF line intensity variations.”.
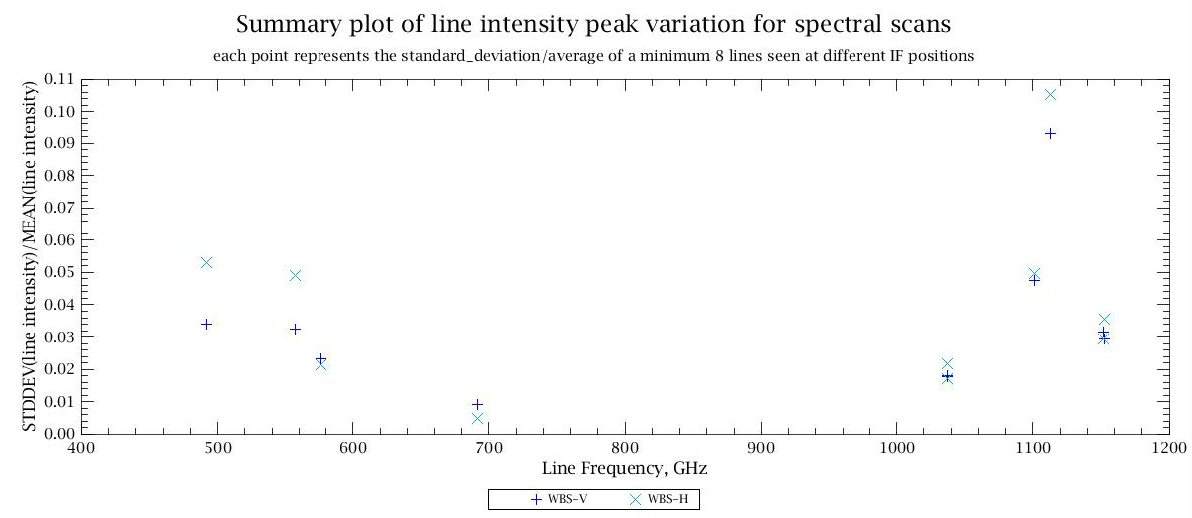
Figure 5.18. Peak intensity variation of spectral lines as measured at 8 or more positions in the IF, from performance verification Spectral Scans..
Combining the information from on-ground ILT testing and in-flight testing a first accurate calculation of sideband ratio across each of the HIFI bands has been made (see Figure 5.19, “Side-band ratios”). These results are expected to appear in the calibrations used in the standard HIFI data processing pipelines used in HCSS version 8.0 onwards (see ???).
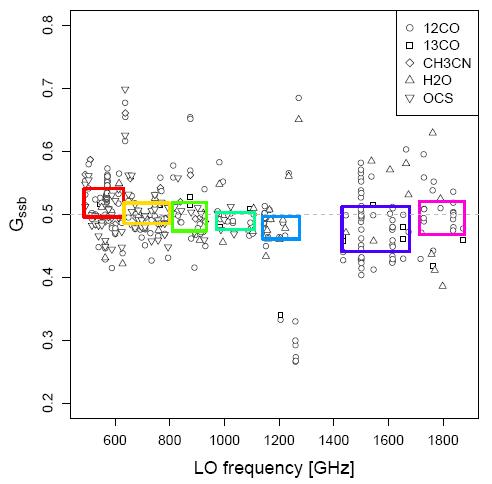
Figure 5.19. Normalized sideband ratio as a function of LO frequency and mixerbands (different colours) - Gssb = 0.5 corresponds to equal gain in USB and LSB. The different gases used are indicated by the different symbols: 12CO circles; 13CO squares; CH3CN diamonds; water upward pointing triangles; OCS downward pointing triangles. Measurements in horizontal polarization have a black outline. The filled boxes delineate all data falling within the first and third quartile.
Table 5.6. Statistics of the sideband ratios per HIFI mixer band. The first column gives the band number. Columns 2 and 3 are the mean and the standard deviation of horizontal and vertical gain ratios combined. Columns 4 and 5 give the 95% confidence interval for the mean values, ideally this should enclose the design value of 0.5. Column 6 gives the relative error as (upper value minus lower value)/(mean value)
Band | Mean | Stddev | Lower value | Upper value | Rel. error (%) |
|---|---|---|---|---|---|
1 | 0.517 | 0.035 | 0.511 | 0.523 | 3 |
2 | 0.508 | 0.047 | 0.499 | 0.518 | 4 |
3 | 0.507 | 0.049 | 0.491 | 0.523 | 6 |
4 | 0.496 | 0.028 | 0.486 | 0.507 | 4 |
5 | 0.462 | 0.090 | 0.435 | 0.490 | 4-6 |
6 | 0.485 | 0.051 | 0.472 | 0.498 | 5 |
7 | 0.495 | 0.054 | 0.474 | 0.516 | 8 |
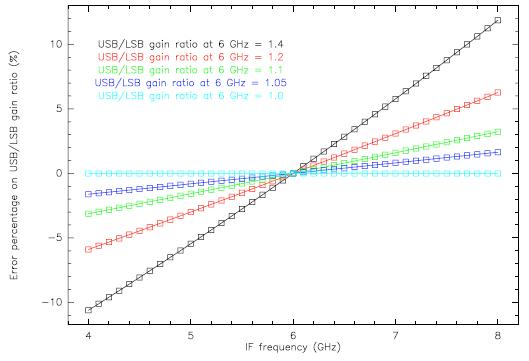
When the gain response of an Double Side Band heterodyne mixer is not equal in its respective Upper and Lower Side bands, the so-called sideband ratio (SBR = Gusb/GGlsb) deviates from unity. Since gain responses are usually smooth functions of the LO frequency, one can assume to first order that this gain function is approximated to a nearly constant slope over a frequency range extending typically from νLO - νIF to νLO + νIF, where νLO and νIF are the LO and IF frequencies respectively. In this assumption, one can demonstrate that when the IF frequency points further away from the LO frequency there is a more imbalanced side-band gain than those IF frequencies closer to the LO frequency. This is illustrated in Figure 5.20, “Sideband ratio variation across the IF”. In this toy model, an example SBR of e.g. 1.16 is assumed at νLO = 570 GHz and νIF = 6 GHz. One can see that the SBR would vary between 1.1 and 1.22 from one end of the IF to the other. Particular care therefore needs to be taken with observations where spectral features are being measured at the opposite edges of the IF band.