The HEB mixers generate waves with characteristics that depend on the mixer current level, but since there is a dependence on LO power which may not be stabilized (between ON and OFF spectra), both electronic and optical standing wave residuals can be mixed together. Data taken with all observing modes analyzed so far show residuals at Level 2, where the non-DBS modes tend to show larger and more complex residuals.
Bands 6-7 are less stable than bands 1-5, and Level 2 data occasionally show residual waves. Examples are shown in Figure 4.12, “Standing wave residuals in Bands 6a and 7b.” for portions of Bands 6a and 7b. The latter was box-car smoothed by 5 channels.
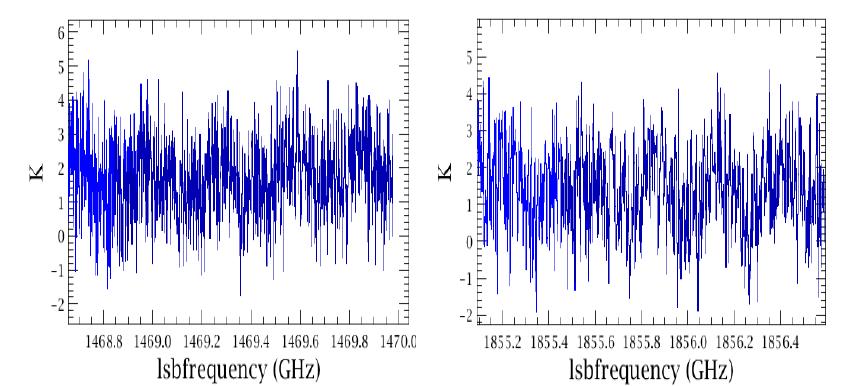
These 'electronic' standing waves have periods of ~300 MHz, but they are not sine waves and 'FitHifiFringe' can only approximately remove them. A promising method ('current matching technique') is being developed to remove these waves in the pipeline.
As for the presence of these waves the following general guidelines can be given:
Band 6b is most stable and is least affected.
FastDBS mode spectra tend to show weaker standing waves than 'slow chop' DBS mode spectra.
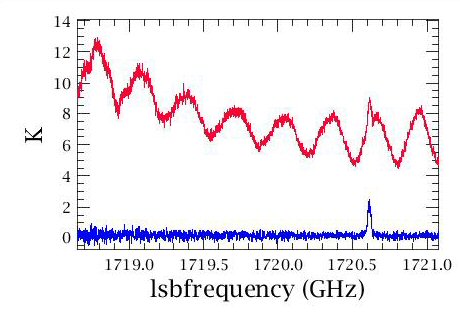
In Band 7, spectra taken with the vertical polarization spectrometers tend to show stronger waves than from the horizontal polarization. Sometimes this effect is very strong. See e.g., Figure 4.13, “Large standing waves in V polarization”.
Non-DBS observations show rather strong residuals in Level 2 spectra. An effort is under way to provide alternative processing of HEB band observations such that appropriate OFF spectra are selected from a database of observations based on mixer current level (the 'current-matching' technique). This approach should reduce the amplitudes of the residual standing waves considerably, but is currently in development. Presently, the user may apply FitHifiFringe to remove the waves in Level 2 spectra. This method has limitations, because the HEB waves are not pure sine waves: they disperse over the IF band (i.e. their 'phase' changes). Figure 4.14, “Standing waves in HEB Load Chop observation” provides an example for HEB measurements using the Point Load Chop mode. As can be seen, the line shape in the WBS-V and WBS-H spectra differ somewhat after subtracting the sine-wave fit. This highlights another limitation of 'FitHifiFringe': for broad lines covering much of the IF, insufficient surrounding baseline may be left to obtain accurate sine wave fits. In addition, as for the diplexer bands, solutions are less accurate for lines close to the IF band edge.
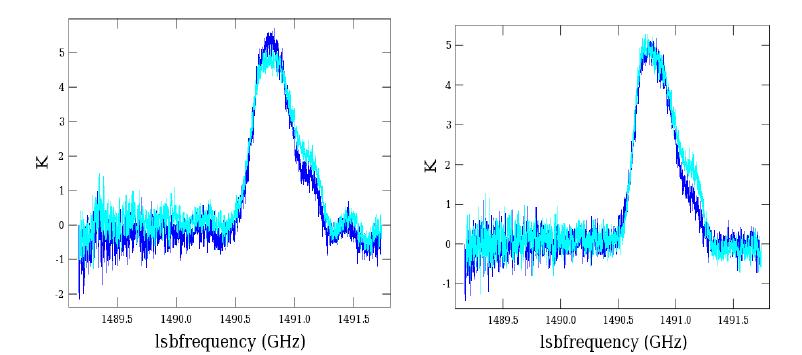
Figure 4.14. A Band 6a Point Load Chop observation showing residual waves after standard level 2 pipeline processing (left), and after standing wave removal using FitHifiFringe (right). The fringe-corrected spectrum has been shifted and a small scaling applied along the intensity axis so that the H and V peaks agree.