Photoconductors of the type used in PACS have been demonstrated to have (dark) noise-equivalent powers (NEP) of less than 5 × 10-18WHz-1/2. Such a noise level would ensure background-noise limited performance of the spectrometer. Tests of the high-stress detectors done at module level in a test cryostat and with laboratory electronics indicate a significant noise contribution from the readout electronics.
These measurements can be consistently described by a constant contribution in current noise density from the CREs and a noise component proportional to the photon background noise, where this proportionality can be expressed in terms of an (apparent) quantum efficiency, with a peak value of 26%. The NEP of the Ge:Ga photoconductor system is then calculated over the full wavelength range of PACS based on the CRE noise and peak quantum efficiency determination at detector module level for the high-stress detectors. The quantum efficiency as a function of wavelength for each detector can be derived from the measured relative spectral response function. Similarly, the absolute responsivity as a function of wavelength is derived from the relative spectral response function and an absolute reference point measured in the laboratory.
The achievable in-orbit performance depends critically on the effects of cosmic rays, in particular, high-energy protons. Analysis of proton irradiation tests indicates that one will face a permanently changing detector responsivity: cosmic ray hit lead to instantaneous increase in responsivity, followed by a curing process due to the thermal IR background radiation.
A preliminary analysis of the results indicates that, with optimized detector bias settings and modulation schemes (chopping + spectral scanning), NEPs close to those measured without irradiation can actually be achieved. It is therefore assumed that this will also apply to the actual conditions encountered in space.
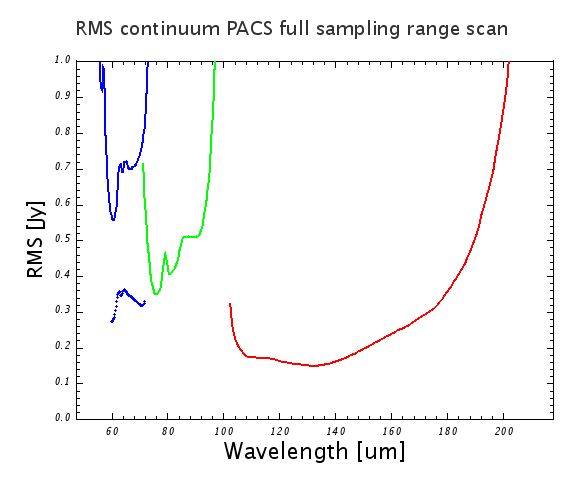
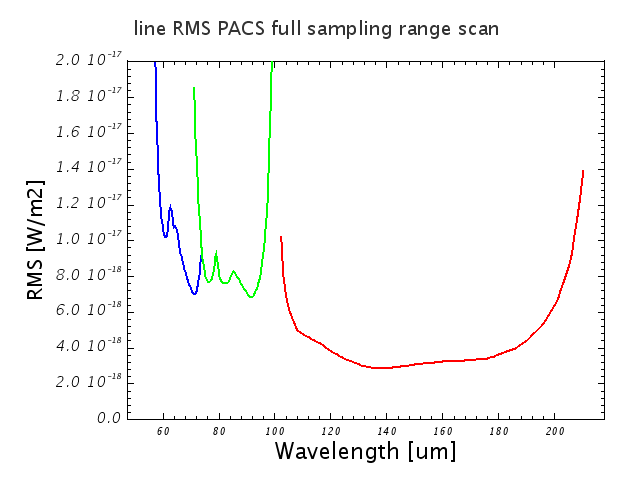
The prediction of spectrometer sensitivity in the high-sampling mode, used in the AOTs line spectroscopy mode and range spectroscopy (with the option "high-sampling") are shown in figures Figure 3.19 and Figure 3.20 for the continuum and line detection respectively.
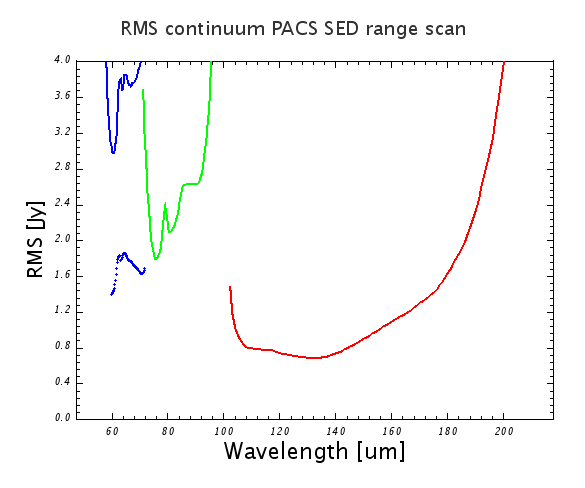
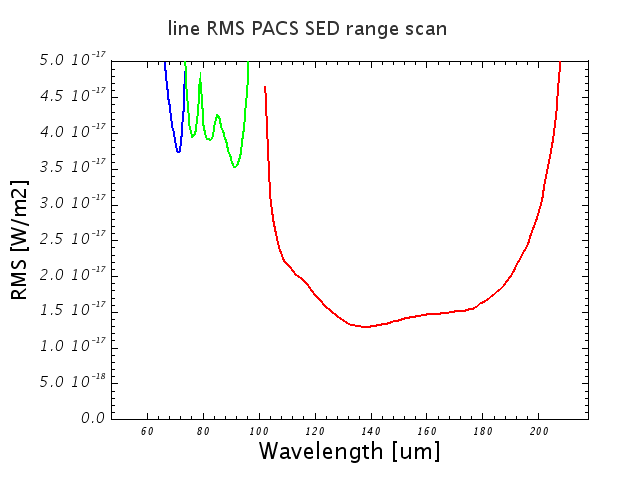
The prediction of spectrometer sensitivity in the SED mode, used in AOT range spectroscopy, with the option "Nyquist sampling" are shown in figures Figure 3.21 and Figure 3.22 for continuum and line detection respectively.
The best 5σ/1 hour sensitivity in the first order corresponds to about 100 mJy for the continuum , 2x10-18 Wm-2 for the line sensitivity and a factor 2.5 worse roughly in the 2nd and 3rd order.

Figure 3.19. Spectrometer point-source continuum sensitivity in high-sampling density mode, for both line/range repetition and nodding repetition factors equal to one, in the line spectroscopy or range spectroscopy AOTs. Solid blue line: third grating order filter A , dotted blue line : second order with filter A green: second order with filter B, red: first order.

Figure 3.20. Spectrometer point-source line sensitivity in high-sampling density mode, for both line/range repetition and nodding repetition factors equal to one, in the line spectroscopy or range spectroscopy AOTs. Blue: third grating order (filter A), green: second order (filter B), red: first order.

Figure 3.21. Spectrometer point-source continuum sensitivity in SED mode (range spectroscopy AOT), for both range repetition and nodding repetition factors equal to one. Solid blue line: third grating order with filter A , dotted blue line : second order with filter A green: second order with filter B, red: first order.
