Table of Contents
- 6.1. Line Spectroscopy AOT
- 6.2. Range Spectroscopy AOT
Two observation schemes are offered for the PACS spectrometer: Line Spectroscopy and Range Spectroscopy Astronomical Observing Templates (AOTs).
Line Spectroscopy AOT: A limited number of relatively narrow emission/absorption lines can be observed for either a single spectroscopic FOV (47" x 47") or for a larger raster map. The fixed angular range scanned by the grating mechanism is optimized for a given diffraction order and ensures the detection of the full profile of an unresolved line with sufficient continuum coverage symmetric to the line centre. Faint- and bright line options are available, for bright lines the redundancy in the spectral domain has been compromized in terms of the angular range scanned by the grating.
Range Spectroscopy AOT: This is a more flexible and extended version of the line spectroscopy mode, where a freely defined wavelength range is scanned by stepping through the relevant angles of the grating with selectable grating sampling density (high sampling density and spectral Nyquist sampling mode). Both arrays are used at a time, spectra can be obtained from the combination of nominal- and parallel ranges. This AOT has to be used for long-range spectroscopy as well as for full coverage of broad spectral lines.
There are two PACS spectrometer observing modes used by both AOTs, background subtraction is achieved either chopping/nodding spectroscopy (Section 6.1.6) for single lines or larger wavelength ranges on point- or small (diamter less than 5') sources with a clean background within 6', and the unchopped grating scan (Section 6.1.8) for single lines or larger ranges on point- or extended sources without clean background for chopping.
![[Note]](../../admonitions/note.png) | Note |
|---|---|
| As a general rule, it is recommended to define any individual PACS Spectroscopy observation (i.e. AOR) no longer than ~5-6 hours. This is rather a safety requirement than a strict restriction on instrument use. In case of a contingency, an observation may not be recoverable (i.e. declared lost for science) but the next observation could be executed again in clean conditions. |
![[Note]](../../admonitions/note.png) | Note |
|---|---|
| The wavelength switching mode (Section 6.1.9) has been decommissioned, and replaced by the 2nd generation 'unchopped grating scan' mode, the optimized solution for crowded-field spectroscopy. |
![[Warning]](../../admonitions/warning.png) | Warning |
|---|---|
| HSpot v5.0 and later versions allow reading of wavelength switching AORs created by older HSpot versions but time estimation has been disabled and submission to HSC is not possible. These wavelength switching observing requests can be updated to unchopped grating scan mode by switching the mode selector button in HSpot (see below for more details). |
The two observing modes can be used in a single pointing, or repeated in a raster pattern on the sky. There are two sets of recommended raster patterns for mapping with full beam sampling: one for compact sources (Section 6.1.5.6), which fit within the instantaneous FOV of the spectrometer, and one for more extended sources (Section 6.1.5.5).
All spectrometer observing requests include a calibration block, a modulated chopped measurement on the two internal calibration sources with the grating in a fixed position. The two sources are heated to different temperatures, hence provide different signal levels. The grating position is chosen to measure a reference wavelength in the bands that are measured in the sky observation. Table 6.1 lists these calibration block wavelengths. The calibration block measurement starts during the slew of the spacecraft to the target in order to optimise the use of observing time. Data obtained in this block can be used for dark-subtraction and for correction of system response changes representative at the start of the observation.
Table 6.1. Key wavelengths. The wavelengths observed in the spectrometer calibration block depend on the spectral bands visited in the rest of the observation
bands | wavelength range (µm) | blue key wavelength | red key wavelength |
|---|---|---|---|
B2A/R1 | 103-220 | 60 | 120 |
B3A/R1 | 51-73 | 60 | 180 |
B2B/R1 | 71-105 | 75 | 150 |
Based on the continuum and line flux estimates entered by the observer in the HSpot PACS Line/Range Editor tables, the expected maximum photoconductor signal level is estimated by the observing logic. For range spectroscopy, the expected flux at the maximum response is extrapolated via a Rayleigh-Jeans law from the reference wavelength and corresponding flux estimate. The appropriate integrating capacitance of the CRE is then chosen for the entire observation to avoid saturation. This way, observer's flux estimates can adjust the dynamic range of the observation.
![[Warning]](../../admonitions/warning.png) | Warning |
|---|---|
| If continuum and expected line fluxes are higher than the saturation limits for the default capacitance, it is mandatory to enter the expected continuum and line flux for every line/range in HSpot. Observations that are saturated because no HSpot flux estimates were entered by the observer will not be considered as failed for technical reasons. Saturation limits are presented in Section 4.12. |
In case the target flux estimates exceed PACS capabilities, i.e. you get an HSpot message stating the observation will be saturated then please contact Helpdesk for further instructions.
This AOT is intended to observe one or several unresolved or narrow spectral line features, on fixed wavelength range of about 1 micron (but varying from 0.35 to 1.8 µm depending on the wavelength and the grating order).
Only lines in the first (103-220 µm) and second order (71-105 µm) combination, or first and third order (51-73 µm) can be observed within a single AOR, to avoid filter wheels movements. If lines of second and third grating order are to be observed on the same target at the same time, two AORs shall be concatenated. Depending on the requested wavelength/grating order, only the data of one of the two detector arrays is normally of interest to the observer.
The fixed wavelength and its immediate neighborhood is observed for each chopper and grating position. For improved flat-fielding, especially for long integrations, the grating is scanned by a number of discrete steps around a specified centre position such that drifts in the detector responsivity between individual pixels are eliminated. The centre position of a grating scan is the corresponding line peak wavelength.
These grating scans provide for each line and for each of the 5 by 5 spatial pixels a short spectrum with a resolving power of ~1700 in its highest resolution covering ~1500 km/s but dependent on the wavelength and order.
Up to 10 lines can be studied within one observation. The relative sensitivity between the lines is controlled by using the line repetition factor, in the PACS Line Editor of the "Wavelength Settings" in HSpot, that allows to repeat a line scan several times. While the absolute sensitivity is controlled by the number of observing cycles in the "Observing Mode Settings", by dedicating a larger amount of time to this observation (integer multiples).
![[Note]](../../admonitions/note.png) | Note |
|---|---|
| A maximum of 10 repetitions in total can be specified in the table. For instance, in the case that 10 lines are selected, the "Line repetition" factor has to be 1 for each line; if 3 lines are selected then the total of the 3 repetition factors has to be less or equal to 10 (e.g. 4+5+1 or 2+3+3 ...). |
Background subtraction is achieved either through standard 'chopping/nodding' (for faint/compact sources) or through 'unchopped grating scan' techniques (for line measurements especially of bright point- or extended sources) of the grating mechanism. The observer can select either chopping/nodding or unchopped grating scan in combination with one of two observing mode settings: pointed and mapping.
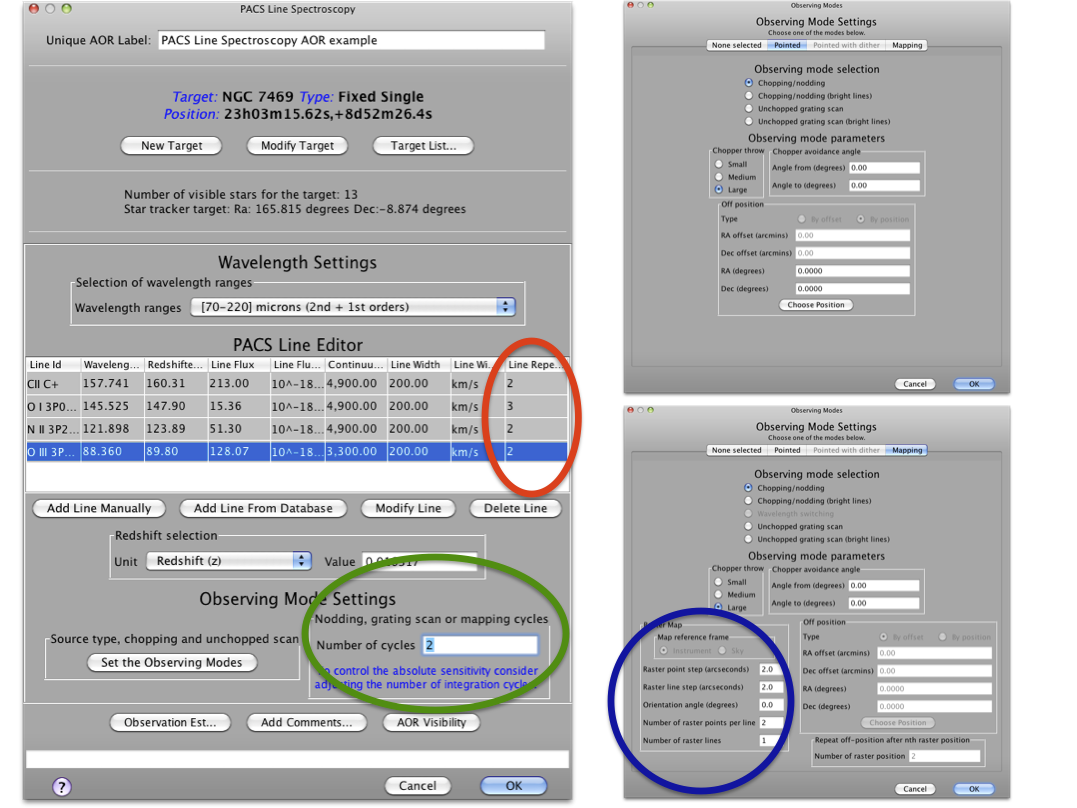
Figure 6.1. The PACS Line Spectroscopy AOT front-end is shown in HSpot v5.0 (left) and the parameter input fields for pointed mode (up right), and for mapping mode (bottom right). The coloured circles indicate ways to adjust the depth of line observations: red shows line repetitions used to adjust the relative depth of various lines in the Line Editor Table; green shows the observing cycles used to apply to adjust the absolute sensitivity; and finally blue in the mapping mode indicates that overlapping footprints in a small raster produce deeper coverage towards the centre of the map.
The uplink logic automatically selects the integrating capacitance based on estimated continuum and line fluxes. If an observation contains lines that fall in different flux regimes, then the largest applicable capacitance will be chosen for the entire observation. If lines in the same observation fall in different flux regimes, it is recommended to split the observation into separate observations per flux regime. The HSpot Time Estimator Message (click on "Observation Estimation / PACS Time Estimator Messages") indicates if other than the default capacitance has been selected for a given combination of lines. Please note, a single bright line could trigger capacitance switching in both red and blue channels, i.e. capacitances are always kept in synch between the two channels. In case a bright red line is grouped together with faint lines in the blue channel then the observation will be sub-optimal in the blue. In such a case it is recommended to regroup lines per channel in two separate AORs.
Spectral regions affected by leakage are discussed in Section 4.8. The measured spectrum in these regions may contain superimposed flux originated in the parallel channel, the interpretation of spectral features (unresolved or continuum fluxes) should be avoided without consulting a PACS expert (i.e. contact Helpdesk).
The default mode for point-source spectroscopy, a single pointing on the source. The integral-field concept allows simultaneous spectral and spatial multiplexing for the most efficient detection of weak individual spectral lines with sufficient baseline coverage and high tolerance to pointing errors without compromising spatial resolution. The PACS spectrometer arrays have 5 by 5 spatial pixels covering a 47 by 47 arcseconds field-of-view respectively, both channels viewing almost identical positions on the sky. The line flux from a point source object will always be collected with the filled detector array, with most the source flux falling on the central pixel. Therefore, for the plain detection of a line source, one pointing is sufficient for a point- or compact source.
This mode allows the observer to set up a pointed observation in combination with chopping/nodding or unchopped grating scan techniques.
![[Warning]](../../admonitions/warning.png) | Warning |
|---|---|
| HSpot v5.0 and later versions allow the reading of AORs in 'Pointed with dither' mode but time estimation has been disabled and submission to HSC is not possible. This mode has been decommsissionned. |
It has been proven during the Performance Verification Phase that flux reconstruction from a single pointed observation is as good as in dithering mode, therefore dithering option is not recommended anymore. For sources with a well confined photocenter (point- or compact sources), the pointing mode can be changed from 'Pointed with dither' to 'Pointed'. To maintain the observation integration time, nod repetition and/or scan repetitions should be increased until the original observing time is reached. Nod or range repetition x 3 should be the appropriate change for most observations. Observations requiring spatial oversampling should use a minimum 2x2 size raster with recommended step sizes.
This mode allows the observer to set up a raster map observation in combination with chopping/nodding or unchopped grating scan techniques.
In chop/nod mode, the map can only be defined in instrument coordinates, and the map size shall be restricted to 6' by 6' to obtain clean offset positions with the large chopper throw for each raster position. The user is therefore advised to build a square raster map to be position angle independent, in other words, to define a map with the same number of raster points and step sizes on the raster X and Y axis.
![[Note]](../../admonitions/note.png) | Note |
|---|---|
| Raster lines are performed along the Z-axis (in contrast to photometer raster map where raster lines are along the Y-axis), i.e. perpendicular to the chopping axis, as can be visualized in HSpot with the AOR overlay functionality. |
In unchopped grating scan mode the map can be defined in instrument- as well as sky coordinates, with a maximum size of 2 degrees, and sparsely sampled maps are possible.
![[Warning]](../../admonitions/warning.png) | Warning |
|---|---|
| In mapping mode, the sensitivity given by HSpot refers to each single raster point and does not take into account internal redundancy. The sensitivity shall increase roughly with the square root of the redundancy factor (number of times a sky pixel is seen by a spectrometer spatial pixel). |
The recommended raster step/line size settings (see below) have been optimised only for zero degree map orientation in instrument coordinates. In case of applying sky reference frame then optimal spatial sampling cannot be guaranteed because the PACS footprint rotation with respect to the raster line orientation depends on the position angle of the detectors footprint (determined by the day of the observation). The sky reference frame can be selected only in unchopped grating scan mode. Please note, in unchopped grating scan mode the HSpot default option is 'sky' reference, but we highly advise to switch to 'instrument' mode except for cases described in Section 6.1.5.2.
![[Note]](../../admonitions/note.png) | Note |
|---|---|
| Time constraints as well as the chopper avoidance angle may be used to put restrictions on the map orientation angle if the map is defined in 'instrument' reference frame. The time constraint can indirectly limit the array position angle in the optimal range, while the chopper avoidance can be used to avoid a certain chopping direction with respect to the target position (see details in the HSpot Users Manual). Map orientation direction restrictions are possible only for targets at high ecliptic latitude, here the spacecraft orbit may result different position angles at different observing epochs. |
In unchopped grating scan mode, if an AOR raster covers an elongated area (e.g. a nearby edge-on galaxy) then the observer might have no other option than using sky reference frame and turn the raster to the right direction. If the target is at higher ecliptic latitude then you may select instrument reference frame and put a time constraint on the AOR. The time window can be identified in HSpot "Overlays/AORs on images..." option by changing the tentative epoch of observation. This way the array can be rotated to the desired angle by the time dependent array position angle. Please consult the HSpot Users Manual for a detailed description how to set time constraints and what consequences apply.
If the map is defined in sky coordinates, the map "orientation angle" in the "Observing Mode Settings" HSpot panel can be used to rotate the raster map, this angle is counted from the celestial north to the raster line direction counterclockwise.
If the map is defined in sky coordinates and the observer wants to cover a contiguous area in the sky, under any position angle he or she shall not define a step size larger than 34 arcsec, i.e. the size of the array (47") divided by √2.
Chopped rasters cannot be rotated with a specific orientation angle, the chop direction is hard-coded in instrument reference frame with zero angle orientation (i.e. the chop direction is perpendicular to a raster line). If the target is at higher ecliptic latitude then put a time constraint on the AOR. This way the array and the whole raster can be rotated to the desired angle by a time dependent array position angle.
For raster maps with stepsize greater than 30" (i.e tiling the sky rather than oversampled rasters) there are no particular recommendations for step sizes. Typical step sizes are 47" (no overlap between the different raster positions) and 38" (approximately one row or column of spatial pixels overlap between the different raster positions).
For extended objects, mapping with oversampling, i.e. with step size smaller than one spaxel, may be very time consuming. Therefore this mapping strategy is suggested with step sizes larger than one spaxel, but such that the beam is Nyquist sampled. Taking into account that what is defined as raster point step in HSpot corresponds to the spacecraft Z axis, and the line step to the Y axis, the recommended raster step sizes (see ???) for Nyquist sampled maps of larger areas translate to the following HSpot settings:
Blue: point step=16.0", line step =14.5"
Red: point step=24.0", line step =22.0"
In order to map the sky at full PACS spatial resolution, step sizes smaller than a spaxel have to be used. Since this increases the observing time, this mode is strongly suggested to be used only for mapping point-like or almost point-like objects. In order to recover the best PACS resolution we recommend the following minimum number of raster positions and maximum step sizes:
Blue: 3x3 raster with step size equal to 3.0" in both directions
Red: 2x2 raster with step size equal to 4.5" in both directions
![[Note]](../../admonitions/note.png) | Note |
|---|---|
| For oversampled maps (Section 6.1.5.5 and Section 6.1.5.6) the optimum separation between raster points has been optimised to a reference beam size in the blue and red channels. In case an AOR contains a mix of blue and red lines/ranges then it is recommended to adopt the blue settings. |
This mode is called "Chopping/nodding" in the "observing mode settings" panel of HSpot. The chopping technique is the standard way of observing with the PACS spectrometer, this mode is recommended especially for faint lines (below 4-5 Jy peak-to-continuum) combined with faint- or bright continuum. Both line flux and continuum level can be recovered from the data. The mode could be used in a reliable way only if clean off-fields are available within a 6' radius with respect the target coordinates.
An observing request can contain up to 10 spectral line scans across different bands with the same fixed order selection filter wheel position. For each observer defined wavelength in the PACS Line Editor, the spectrometer performs grating scans with an amplitude such that a given wavelength is seen successively by all 16 spectral pixels of the detector. The sampling density per resolution element is higher than 3 samples per FWHM of an unresolved line at all wavelengths with 43, 46 and 48 grating steps in the first, second and third order respectively (see scan parameters in Table 6.2). A single grating scan is repeated in two directions. This up/down scan can be repeated up to 10 times for a single line. Table 6.3 shows the wavelength range covered in the different bands.
Table 6.2. Scan parameters in line scan modes. Grating settings are shown for three bands and for the faint- and bright-line options separately; the duration of atomic observing blocks are for a single grating up- and down scan without overheads; the oversampling factor gives the number of times a given wavelength is seen by multiple pixels in the homogeneously sampled part of the observed spectrum.
band | wavelength range (µm) | grating step size | grating steps, faint lines | oversampling factor, faint lines | 1 scan duration (sec), faint lines, chop/nod | grating steps, bright lines | oversampling factor, bright lines | 1 scan duration (sec), bright lines | 1 scan duration (sec), unchopped grating scan |
|---|---|---|---|---|---|---|---|---|---|
B3A | 51-73 | 168 | 48 | 41.1 | 384 | 10 | 10.0 | 80 | 384 |
B2B | 71-105 | 188 | 46 | 36.2 | 368 | 10 | 10.0 | 80 | 368 |
R1 | 103-220 | 240 | 43 | 27.9 | 344 | 10 | 10.0 | 80 | 344 |
Table 6.3. Spectral coverage in line scan. The wavelength range seen in a nominal line scan varies over the spectral bands. The column 'highest sensitivity range' refers to the range that is seen by every spectral pixel.
band | wavelength (µm) | full range (km/s) | full range (µm) | highest sensitivity range (µm) | FWHM (µm) | FWHM (km/s) |
|---|---|---|---|---|---|---|
B3A | 55 | 1880 | 0.345 | 0.095 | 0.021 | 115 |
B3A | 72 | 799 | 0.192 | 0.053 | 0.013 | 55 |
B2B | 72 | 2658 | 0.638 | 0.221 | 0.039 | 165 |
B2B | 105 | 1039 | 0.364 | 0.126 | 0.028 | 80 |
R1 | 105 | 5214 | 1.825 | 0.875 | 0.111 | 315 |
R1 | 158 | 2869 | 1.511 | 0.724 | 0.126 | 240 |
R1 | 175 | 2337 | 1.363 | 0.654 | 0.124 | 210 |
R1 | 210 | 1314 | 0.92 | 0.441 | 0.098 | 140 |
At every grating position, the detector signal is modulated between on and off source via an [on-off-off-on]-[on-off-off-on] chopping pattern. In order to take advantage of the best spectrometer sensitivity, at every chopper plateau two 1/8 second integrations of the photoconductor signals are recorded. These integration ramps of 1/8 second length are fitted on-board PACS, therefore the signal transmitted to the ground is represented by the slope of the ramp in units of [ADU/reset interval].
The observer can choose a chopper throw of "Small", "Medium" and "Large" what refering to 6', 3'or 1.5' respectively. The apparent chopper throw is curved on the sky. This rotates the on-source spectral footprint in the two nod positions, and this rotation becomes larger with increasing chopper throw (see Section 4.5).
![[Note]](../../admonitions/note.png) | Note |
|---|---|
| It is recommended to select the "Small" (1.5') chopper throw if applicable for the target (i.e. well isolated point-sources) in order to reduce the effect of field-rotation between the two chop positions (see Figure 6.3). |
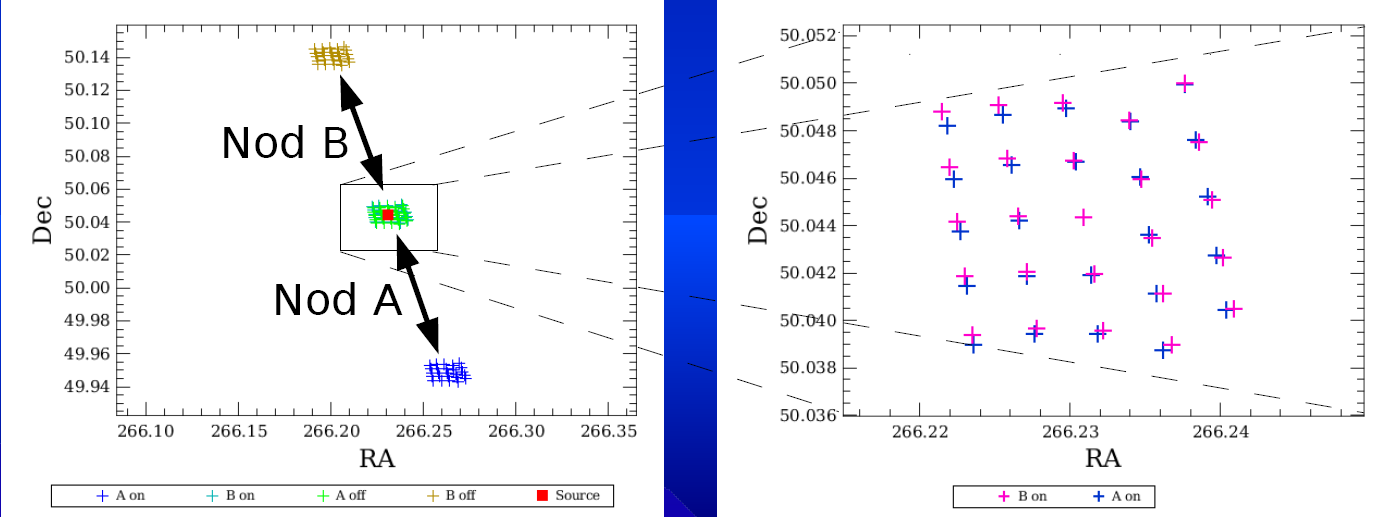
Figure 6.3. Spatial footprint layout of the chop/nod observing mode: two chopper positions are shown for nod A and B. The zoom in the on-source position reveals the field-rotation between the two chop positions.
![[Note]](../../admonitions/note.png) | Note |
|---|---|
| In case some disturbing sky features would fall in within the chopper throw radius around the target, the observer has to consider to setup a chopper avoidance angle constraint. The angle can be specified in equatorial coordinates counterclockwise with respect the celestial north. The avoidance angle range can be specified up to 360 degrees with a minimum range of 15 degrees, to avoid too much restrictions on scheduling. Setting up a chopper avoidance angle requires an additional constraint on mission planning, therefore this parameter should have to be used only for observations where it is absolutely necessary. |
The sequence of line scans is repeated at two nod positions of the telescope. In the second nod position (nod B), the source is located in the off chopping position of the first nod (nod A). With this technique, one can eliminate the telescope background what happens to be different at the optical angle of the two chop positions: F(observed) = [NodA(on-off)] + [NodB(on-off)] / 2 = [(T2+F(source)-T1] + [(T1+F(source)-T2] / 2 = F(source), where T1 and T2 are the telescope background fluxes at the two chopper positions. (In this term we assume the sky background is negligible compared to the telescope background.) The nod sequence can be repeated within one observation to increase the depth of the observation. Nod cycles are repeated in a way that A-B slew times are minimised, for instance, in case of two repetitions the spacecraft follows the pattern: [A-B-B-A]. In chop/nod mode in total, one half of the science time is spent on-source. The principle of line spectroscopy is illustrated in the diagram of subsequent instrument and spacecraft observing blocks in Figure 6.5.
![[Note]](../../admonitions/note.png) | Note |
|---|---|
| For low number of repetitions (up to 5-6) it is recommended to repeat line scans (increase line repetition factor), while for deeper observations line repetitions should be combined with a number of nod cycles. |
![At each grating position in an up/down scan 16 ontegration ramps are taken (plus 1 for synchronisation at the begnning). The ABBA sequence represents a chopper [on-off-off-on] cycle which is repeated two times. The duration of such a grating plateau is [8 integrations] x [1/8 sec integration time] x [2 ABBA cycles] = 2 seconds.](../images/figAotABBA2.png)
Figure 6.4. At each grating position in an up/down scan 16 ontegration ramps are taken (plus 1 for synchronisation at the begnning). The ABBA sequence represents a chopper [on-off-off-on] cycle which is repeated two times. The duration of such a grating plateau is [8 integrations] x [1/8 sec integration time] x [2 ABBA cycles] = 2 seconds.
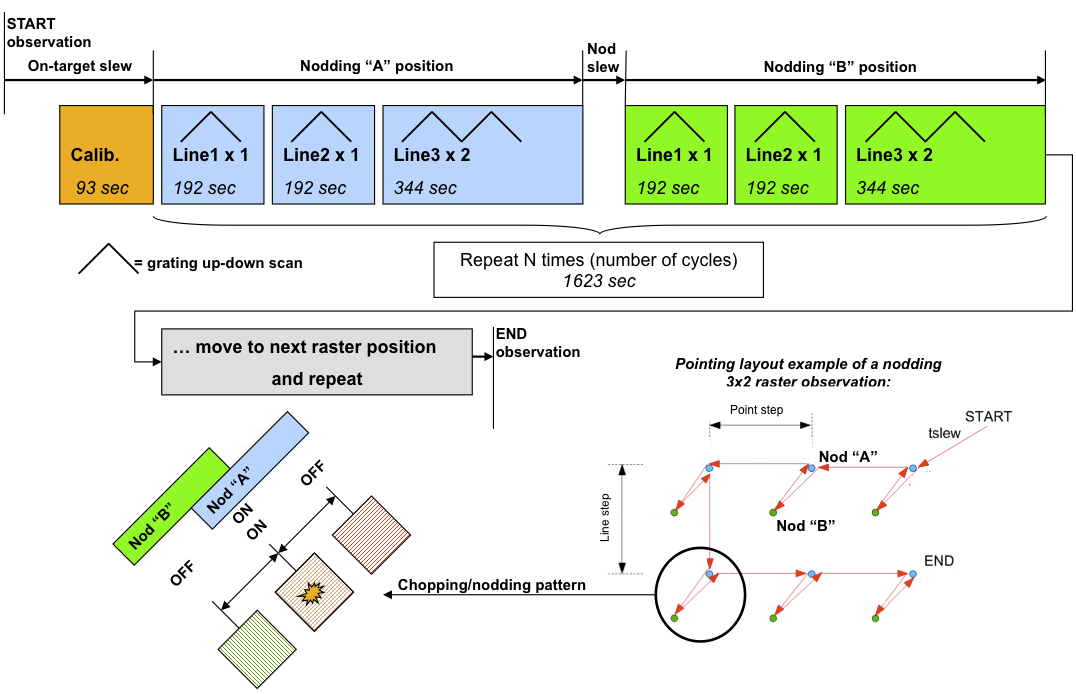
Figure 6.5. Instrument observing blocks are shown for a typical chop/nod measurement combining two lines with single repetition in B3A and a third line with two repetitions in band R1 (3rd + 1st orders setting). Line repetitions adjust the relative depth required for spectral lines, while the number of observing cycle is used to repeat the entire nodding cycle. In the bottom the spatial layout of the chop/nod scheme is sketched. Note, the raster patterns has been distorted for better visibility, in real observations, the nod slew is significantly larger than the raster step size and nodding direction is enforced along the raster columns (vertical direction).
The full wavelength range covered by the scan and the range covered to the highest sensitivity, i.e. the wavelength seen by all 16 spectral pixels are shown in Table 6.3 and compared with respective FWHM of the spectrometer at these wavelengths, for an unresolved line. The spectral coverage in line spectroscopy modes is shown in Figure 6.6. The reference for the wavelength range as specified in HSpot is spectral pixel 8, i.e. the predefined range is not covered by all spectral pixels, and the actual range in the data has S/N going up at the edges.
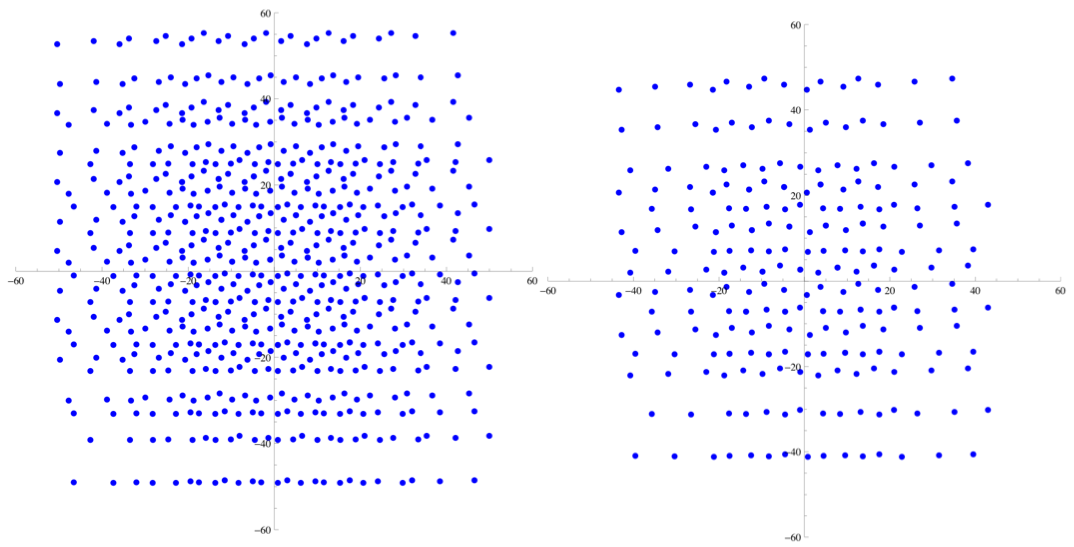
The spatial layout of a pointed measurement is shown on Figure 6.7 where the 25 spaxels for the foure chop/nod position are projected onto the sky.
Chopping and nodding is imposed by the design of the AOT, in other words if chopping/nodding is deselected, the unchopped grating scan is selected instead, as both observing techniques are mutually exclusive.
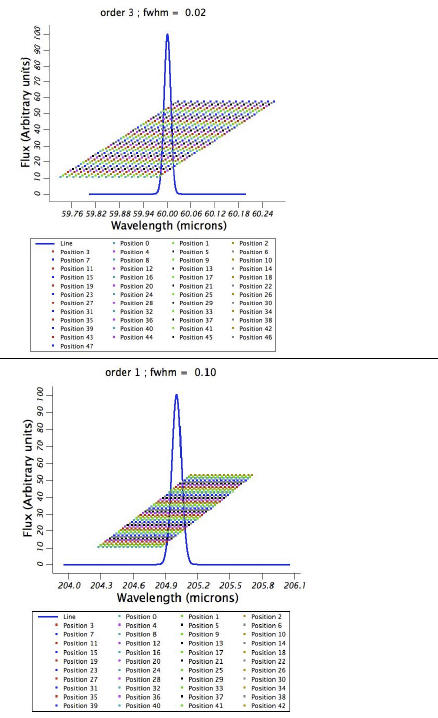
Figure 6.6. Visualization of the line scan AOT on an unresolved PACS line (here given by a Gaussian). The grating step size and number of grating positions used is the nominal one currently coded in AOT design for standard "faint lines" summarized in Table 6.2. Top row is for a blue line at 60µm; bottom row is for a red line at 205µm. In bright line mode, grating step sizes are identical but the instrument scans over only the 10 central positions. These scan patterns are identical for chopped- and unchopped modes.
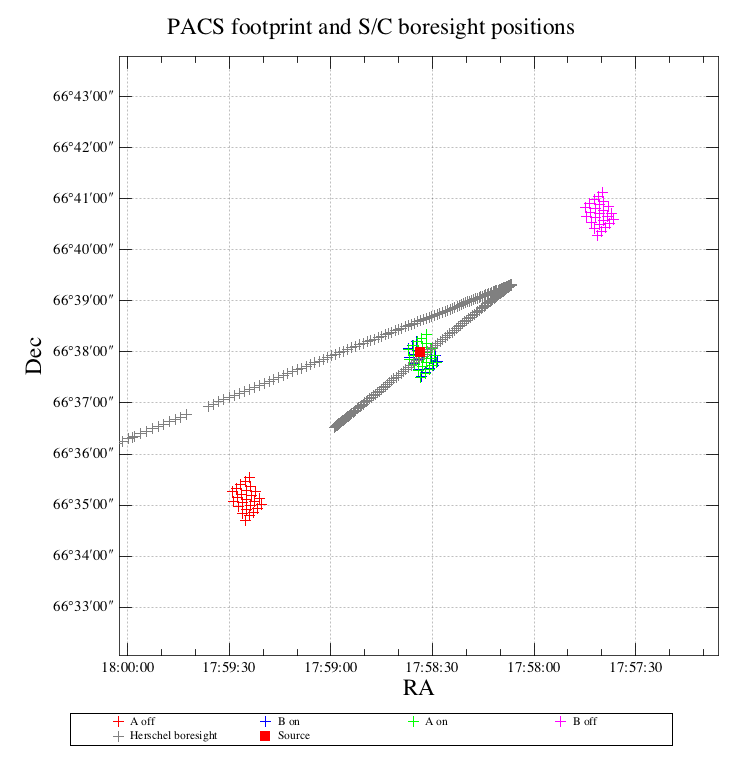
Figure 6.7. The PACS spectrometer footprint of a chop/nod pointed observation is shown for the blue band. The four fields of nod A and B positions combined with chop on- and off fields are plotted as well as the instrument boresight (grey) and target position (red). In this example observation large chopper throw (6') was used which is a result of a symmetrical chopping pattern around the instrument boresight.
This mode is devoted to bright lines where it is not needed to spend as much time per line as in the standard chopping/nodding mode with a single repetition. Up and down grating scans are performed but only with 10 grating steps, i.e. the on-sky time about 3-4 times shorter than in the standard chopping/nodding mode depending on the band. A comparison of bright line mode scan parameters can be found in Table 6.2.
The observing efficiency of this mode is rather poor because of fixed incompressible overheads (nod slew time and instrument overheads). The minimum total observing time (one line, one cycle) is 303s versus 583s in the standard chopping/nodding, while it is about twice less sensitive: the sensitivity ratio per resolution element in the highest sensitivity part of the coverage is about 0.6. (Sensitivity ratio is driven by the respective oversampling factors, sqrt(10 / 27.9)) If several lines are observed the modes becomes more attractive, but line repetition factor as well as nodding cycles should be equal or less than 3.
In bright line mode, even for unresolved lines, the central 3 pixels in a 16 pixel module do not "see" the continuum, they scan over the line profile only. This could make difficult a proper response correction as no flat continuum level can be determined for all the pixels.
![[Note]](../../admonitions/note.png) | Note |
|---|---|
| Since the bright line mode scans about 1/4th of the wavelength range scanned in faint line mode for broadened lines this might limit the wavelength extent of the baseline measured. |
The unchopped grating scan is an alternative to the chopping/nodding mode if by chopping to a maximum of 6' the off position field-of-view cannot be on an emission free area, for instance in crowded-fields or for spectral line mapping of extended objects with diameter larger than 5' respectively. The direct way of acquiring data raises limitations on the applicable flux regime with respect to the standard chop/nod mode. This mode is not recommended for very faint lines, target lines needs to be above typically ~1 Jy peak-to-continuum and the continuum level can be recovered in a reliable way only for bright sources, i.e. at a minimum continuum level of ~ 20-30 Jy.The continuum level can be determined by off-position subtraction which could efficiently eliminate the telescope background for bright objects.
In this default version of the unchopped grating scan mode, the line is scanned with the same grating step as in chopped line spectroscopy, i.e., every spectral pixel samples at least every 1/3 of a resolution element. The number of grating steps is fixed to 75 irrespective the spectral band in which the line is observed. Other grating scan parameters and block duration are shown in Table 6.2.
A key element in the unchopped mode is to make this technique robust against instantaneous responsivity changes caused by cosmic ray hits in the Ge:Ga detector pixels. For this purpose, the up/down grating scan have been made much faster than in the chopped mode, and every line repetition requested by the observer is doubled internally by PACS. On every grating position, four integration ramps are taken. Each integration lasts 1/8 s, resulting in a grating scan which is four times faster than the one in chop mode.
The sensitivity of an observation performed in the unchopped line-scan mode is quite similar to that obtained in chop-nod when the time spent on source is taken into account. This conclusion is based on actual observations of several galaxies in which bright lines were observed both in chop-nod and in unchopped mode. Both the line shape and the strength of the line (when differences in the calibration procedures are taken into account) are very similar. Figure 6.8 shows the observation of a line in the red spectrometer observed in both chop-nod and unchopped mode. Except for differences in the continuum level, the line is well reproduced in both cases. Note that in this example both unchopped observations over-estimate the continuum by 30% compared with the chopped case, and are also different by 10% between two separate spectra taken in separate observations. This continuum uncertainty for faint targets has been discussed previously, observers should not use this mode to measure the continuum.
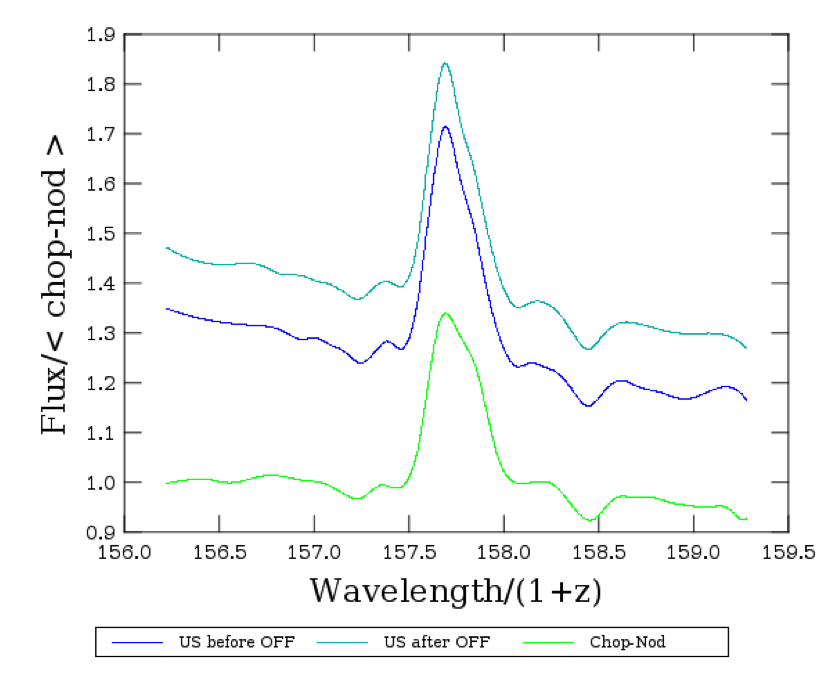
Figure 6.8. A comparison of same faint red emission line source observed with unchopped mode and a chop/nod observation. The turquoise and blue spectra are the two unchopped spectrum taken in different observations and show a variation between each other in the continuum of the order of 10%. The Green spectrum shows the same source observed in chop-nod mode where the continuum is much more accurately measured, and is lower than the unchopped mode by approximately 30%. Note that the line itself is well reproduced in both flux and line shape. The systematically larger amplitude of the line-signal seen in the unchopped mode compared with Chop/Nod (roughly 10%) is a known artifact of the way the line is calibrated in this example, using methods designed for chop-nod calibration. Future calibration tables designed for the unchopped Mode will remove this scaling difference.
The example of an observing block sequence of the unchopped grating scan mode is sketched in Figure 6.9. In the on-source block, the observer defined line repetitions are internally multiplied by two, i.e. a single repetition is made of two fast scans. The on-source integration time in this mode is half the time PACS spends on-source in the chopped mode (including both nod positions).
In pointed mode, following an on-source block the spacecraft slews to an off-position within two degrees radius with respect to the target coordinates. The off-position has to be carefully selected for an efficient subtraction of the telescope background. Ideally, the background sky emission towards the target and towards the off-position is at the same level respectively, and the background field is free of confusing structures (i.e. the 25 spaxels see a similar level of sky emission).
The off-position is always executed with a single repetition, irrespective what the observer has defined for line repetition factor in the PACS Line Editor. This means, the duration and signal-to-noise in the off-position blocks will be lower than the on-target block, if line repetition factor has been set larger than one.
![[Note]](../../admonitions/note.png) | Note |
|---|---|
| The repetition cycle has to be used to increase the exposure, the entire on-off block is repeated as is in the chopped mode. For instance, in two cycles the spacecraft follows an [ON-OFF-OFF-ON] pointing sequence between the two positions. For deep observations, if necessary, the off-position duration could be kept identical to the on-source duration by specifying single line repetitions and higher number of observing cycles. However, this parameterization is inefficient in terms of slewing overheads. |
![[Note]](../../admonitions/note.png) | Note |
|---|---|
| While the scheme in the block diagram Figure 6.9 can be executed, it may turn more advisable to rather do this line by line, particularly for rasters with not too frequent off positions. |
![[Note]](../../admonitions/note.png) | Note |
|---|---|
| A shorter integration time in the OFF-position results in a RMS noise of the reference continuum higher than that of the source continuum. To avoid to increase the RMS noise when subtracting the OFF-position, the OFF-position data can be binned using larger wavelength intervals. In case of flat continuum, a single value can be computed for the reference continuum. |
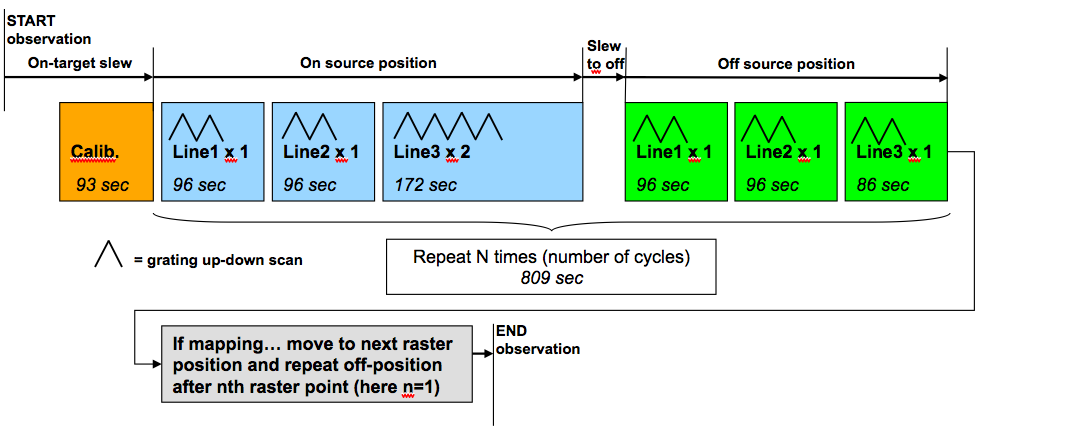
Figure 6.9. Instrument observing blocks are shown for a typical unchopped grating scan measurement combining two lines with single repetition in B3A and a third line with two repetitions in band R1 (3rd + 1st orders setting). Line repetitions adjust the relative depth required for spectral lines, while the number of observing cycles is used to repeat the entire on-off cycle. In this example, the off-position is only 6' away from the target what results only short on-off slewing overhead.
In raster mapping mode the observing block sequence is similar to the chopped mode but here the observer could define the number of raster positions to visit before moving to the off-position.
![[Note]](../../admonitions/note.png) | Note |
|---|---|
| In mapping mode, the observing cycle is repeating the entire raster. At least one OFF-position has to be specified for a single cycle, i.e. the number of raster positions to visit before moving to the OFF-position has to be equal or lower than the number of raster positions ([num. raster lines] x [num. of raster points]) |
In raster mode, PACS executes an obligatory OFF-position before the first science block starts at the first raster position. For instance, in case of a 2x2 raster, with a single cycle and with an off position request after 2 raster positions, the following spatial pattern will be executed: [OFF-ON-ON-OFF-ON-ON-OFF]. The same raster with two cycles: [OFF-ON-ON-OFF-ON-ON-OFF-ON-ON-OFF-ON-ON-OFF].
This bright-line option has been made available in HSpot version 5.3.1 and later for science cases where very high signal-to-noise (S/N > 100) line detections are expected applying a single line repetition factor. For such bright targets, the integration time can be kept shorter than as is in the default faint-line mode, even on the expense of compromised observing performance.
In this mode, grating scan parameters and observing logic remain unchanged, except the number of grating steps visited by a single scan. Instead of applying the default 75 steps, a bright line scan is done through 50 steps, resulting a factor 1/3 reduction in integration time. The shorter duration scan is therefore achieved via a shorter wavelength coverage, the scan speed (number of integration ramps per grating position) has not been changed. Due to instrument and spacecraft overheads the 33% gain in integration time does not apply to the total duration of a bright line AOR. Typically, a bright line AOR is shorter by 25-30% than its faint-line homologue. We show in Figure 6.10 the spectral coverage of the bright-line and standard unchopped mode.
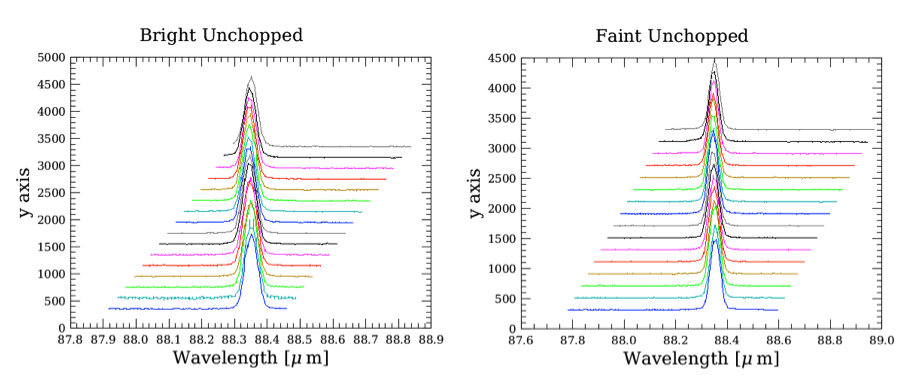
Figure 6.10. The unchopped bright line mode (left, 50 grating steps) covers a narrower wavelength range than the standard faint-line implementation (right, 75 grating steps). Colours represent the coverage of individual 16 spectral pixels in a module while the grating scans through a spectral line.
![[Note]](../../admonitions/note.png) | Note |
|---|---|
| The shorter wavelength coverage on both sides of the line profile may result a higher uncertainty in the continuum level reconstruction. HSpot sensitivities therefore report 30% increase in S/N if the bright-line mode is used. You can see a comparison of bright- and faint-line mode observations on Figure 6.11. |
Because the bright line mode is faster than the standard unchopped mode (and because we recommend only using the mode with 1 repetition), then automatically the “off position” will be observed quite soon after the target is observed. This may be a small advantage compared with the standard unchopped mode since, in principal, detector transients may be better handled. At the time releasing this document do not have sufficient data to determine if this is a significant gain.
It should be noted that the unchoppped bright-line mode does not sample the spectrum as uniformly, nor as comprehensively as the standard unchopped mode (50 instead of 75 grating steps). Thus there is much less redundancy in the measured sampling of the edges of the band in the bright-line case. This has two effects. Firstly, the number of points that can be binned in a given spectral resolution element is less at the spectrum edges—leading to a larger rms away from the center of the observed spectrum. Secondly, systematic uncertainties in the RSRF, which are partly averaged-out when many spectral pixels contribute to a given resolution element, are subject to systematic effects at the edge of the band. This can lead—in some cases, to slopes in the baseline of the spectrum near the spectrum edges. Such slopes are much less noticeable in the standard unchopped mode. However, if the line is strong enough these effects will be relatively insignificant when compared to the strength of the line—even in the bright line mode. However if the line is too faint, this could become a serious problem and should be avoided.
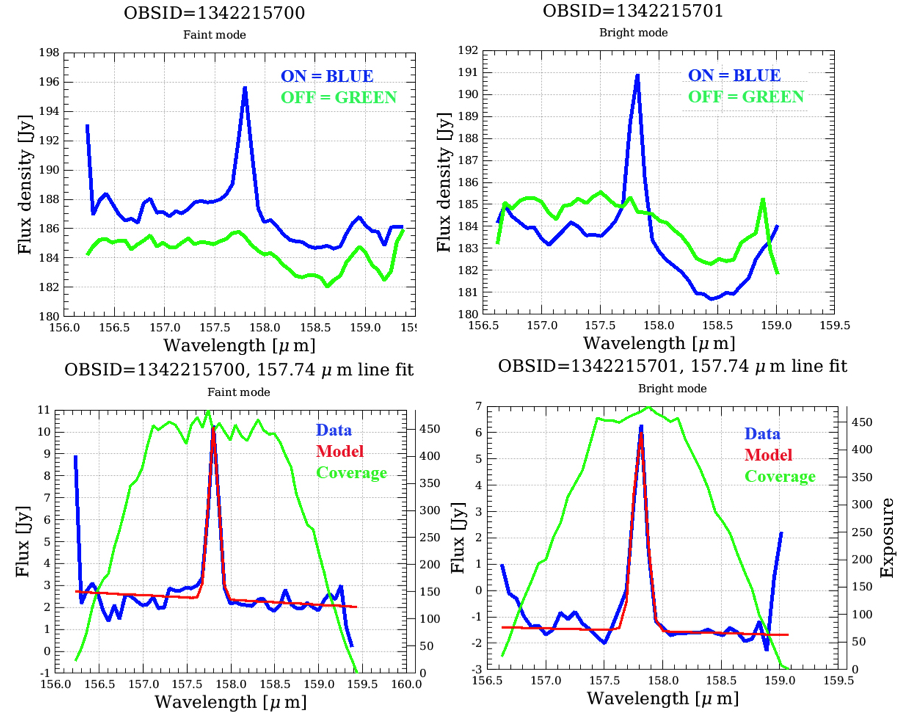
Figure 6.11. A comparison between standard unchopped (faint) and bright line mode for on and off observations. The upper figures show the on and off observations (blue and green) and the lower figures show the difference spectra. The green line shows the spectral coverage frequency, which is a measure of the number of samples averaged in each wavelength bin. Notice how the broader coverage of the faint line mode produces a flatter baseline than the bright-line mode.
The choice of “off” frequency is a user-defined quantity and will depend on the science goals. If you are primarily interested in line properties then obtaining an “off” at a convenient point in your observational sequence roughly every 30-60 minutes would be ideal.
For unchopped line scan the mode is set up so that the observer gets an “off” at the end of the observing sequence. To ensure that the “off” is observed every 30-60 minutes, it is desirable to arrange that the main observing block does not last more than 30-60 minutes. So for example, for a single “pointed” observation, since a single line takes rough 10 minutes to execute, three to six separate lines could be observed within the AOR. At the end of this period an “off” observation will be executed. If a small map is executed, the user should balance the efficiency of the map making with the need for a frequent “off”. It may be more efficient to allow the map to execute to the end of a small map before going to the “off”. This would be achieved by setting the “Repeat off position after nth rater position” variable an appropriate value. To give an example. If a single line is observed on a 2 x 2 raster, setting the “repeat off position after nth raster” to 4 will ensure that the “off” is taken at the end of the sequence resulting in an AOR of duration 23 minutes—which would be ideal. If two lines were observed for the same map, the same parameters would lead to an off being taken at the end of the sequence, which in this case would be after approximately 40 minutes—which is still acceptable. Observations with the “off” taken up to 2 hrs from the “on” still seem to produce results that show only a small degradation in S/N ratio, although we recommend keeping the interval as short as possible. In this mode “off” positions of up to 2 degrees from the target may be specified.
![[Note]](../../admonitions/note.png) | Note |
|---|---|
| The user can specify an “off” position, either by offset or by RA and Dec specification. Note that by default these offsets are set to zero and it is important that the user specify a non-zero value away from the target. The specification of an “off position” is provided in a special part of the HSpot window for both the “Pointed” and “Mapping” component of the “Set Observing Mode” option. |
The wavelength switching technique/mode is an alternative to the chopping/nodding mode, if by chopping to a maximum of 6 arcminutes, the OFF position field-of-view cannot be on an emission free area, for instance in crowded areas.
![[Warning]](../../admonitions/warning.png) | Warning |
|---|---|
| The wavelength switching mode has been deprecated in HSpot v5.0 and later versions. For crowded-field spectroscopy, and in more general, for science cases where chopping is not possible it is advised to use the unchopped range scan mode instead. Observers with AORs in wavelength switching mode could still read these observations in HSpot but time estimation is not possible any further. |
In wavelength switching mode, the line is scanned with the same grating step as in chopped line spectroscopy, i.e., every spectral pixel samples at least every 1/3 of a resolution element. In wavelength switching we refer to this step as a dither step. At every dither step, the signal is modulated by moving the line over about half of the FWHM. This allows one to measure a differential line profile, canceling out the background (Figure 6.12). The modulation on every scan step follows an AABBBBAA pattern, where A is a detector integration at the initial wavelength, and B is a detector integration at the wavelength switching wavelength. This cycle is repeated 20 times in one direction, and repeated in the reverse wavelength direction. The switching amplitude is fixed for every spectral band.
In order to reconstruct the full power spectrum, a clean off- position is visited at the beginning and the end of the observation. On this position the same scan is performed. In between, the scan is performed at two or more raster positions.
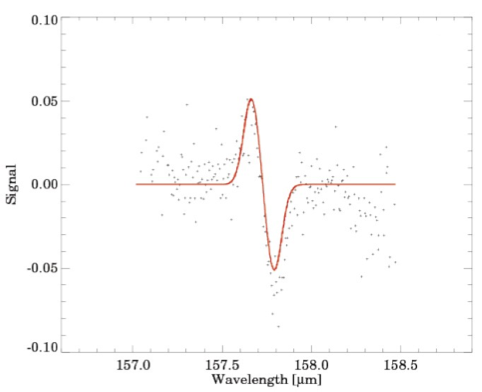
Figure 6.12. Reconstruction of emission line flux in the differential wavelength switching mode (by fitting a differential Gaussian).
Wavelength switching can be used for large extended sources since no clean reference is needed. But it shall be used with caution: by definition this technique eliminates the continuum information. Besides the baseline estimates, line profiles are not be reliable if:
a noticeable gradient is present in the continuum flux over the performed wavelength throw,
blends of line forests disturb the wavelength switch interval.
Table 6.4. User input parameters for Line Spectroscopy AOT
Parameter name | Signification and comments |
|---|---|
Wavelength ranges |
Which of the two order combinations to use:
As a result of the selection, the (redshifted) wavelengths of line centres have to be specified in the "PACS Line Editor" table, either within the 70-220 microns band, or within the 51-73 and 103-220 microns band. |
Wavelength (microns) |
Mandatory parameter. The rest wavelength of the line centre. If no redshift is specified, the PACS grating will perform an up- and down scan, centred around the line's central wavelength. |
Redshifted wavelength (microns) |
Parameter calculated by , it appears only in the PACS Line Editor and indicates the redshifted wavelength of the line centre. The bottom pull-down menu allows the reference frame for the redshift to be input. |
Line flux unit |
This menu gives the flexibility to switch between physical input units supported by the PACS AOT logic. |
Line flux |
Optional parameter. User supplied line flux estimate in units specified by the "Line Flux Units" option. Line flux input is used for signal-to-noise estimation as well as for the optimization of the dynamic range. Leaving the parameter as the default 0.0 value means the PACS Time Estimator will not perform signal-to-noise estimation (sensitivity estimates are still provided) and default integration capacitor may be used providing the smallest dynamic range. |
Continuum flux density (mJy) |
Optional parameter. Continuum flux density estimate at the line (redshifted) wavelength. The value of this parameter is interpreted by the PACS Time Estimator as flux density for a spectrometer resolution element. Leaving the parameter as the default 0.0 value means the PACS Time Estimator will not perform signal-to-noise estimation (sensitivity estimates are still provided) and default integration capacitor may be used providing the smallest dynamic range. |
Line width unit |
This menu gives the flexibility to switch between physical input units supported by the PACS AOT logic. |
Line width (FWHM) |
Optional parameter. The spectral line full width at half maximum value in units specified by the "Line Width Units" pull-down menu. Line width input is used only for checking purposes. It helps the observer to ensure the specified line width fits within the predefined wavelength range hard coded in the PACS Line Spectroscopy AOT logic |
Line repetition |
Mandatory parameter. The relative line strength (fraction of on-source time per line) is taken into account by specifying the grating scan repetition factor for each line. A maximum of 10 repetitions in total can be specified in the table. For instance, in the case that 10 lines are selected, the "Line repetition" factor has to be 1 for each line; if 3 lines are selected then the total of the 3 repetition factors has to be less or equal to 10 (e.g. 4+5+1 or 2+3+3 ...). If the sum of repetitions exceeds 10 then you must either remove spectral line(s), or reduce the scan repetition factor(s). |
Redshift Selection |
The redshift selection menu allows the observer to make adjustments to the observing wavelength. The input can be specified either in known radial velocities or redshifts. Once any area in the PACS Line Editor is clicked on the "Redshifted Wavelength" field turns to show the wavelength to be observed. |
Nodding, unchopped grating scan or mapping cycles |
The absolute sensitivity of the observation can be controlled by entering an integer number between 1 and 100. In chop mode, the on-source time is increased by repeating the nodding pattern the number of times that is entered. For each of the nod positions the sequence of line scans is repeated with the relative depth specified in the PACS Line Editor. In case of unchopped grating scan mode, this cycle is used to repeat the ON-OFF blocks the number of times that is entered. |
Chopper throw |
The chopper throw and chopper avoidance angle can be selected. The choice of "Small", "Medium" and "Large" refer to 1.5, 3.0 and 6.0 arcminutes chopper throws respectively on the sky. The chop direction is determined by the date of observation; the observer has no direct influence on this parameter. If an emission source would fall in within the chopper throw radius around the target the observer may consider setting up a chopper avoidance angle constraint. The angle is specified in Equatorial coordinates anticlockwise with respect the celestial North (East of North). The avoidance angle range can be specified up to 345 degrees. |
Setting the map size |
The centre of the map is at the coordinates given by the target position. The map size along a raster line can be expressed as the number of raster points per line times the raster point step. In perpendicular direction, the map size is given by the number of raster lines times the raster line step. Mapping parameter ranges are defined as:
Please consult Section 6.1.5.4, Section 6.1.5.5 and Section 6.1.5.6 for instructions how to set up optimal step sizes. |
Setting the map orientation angle |
Selecting the chop/nod mode the map (raster line) orientation is defined by the chopping direction, the observer has no direct access to the map orientation parameter (disabled field). The sky reference frame can be selected only in unchopped grating scan mode. Please note, in unchopped grating scan mode the HSpot default option is 'sky' reference, but we highly advise to switch to 'instrument' mode if suitable for the science case. In unchopped grating scan mode, if an AOR raster covers an elongated area (e.g. a nearby edge-on galaxy) then the observer might have no other option then using sky reference frame and turn the raster to the right direction. If the target is at higher ecliptic latitudes then you may select instrument reference frame and put a time constraint on the AOR. The appropriate time window can be identified in HSpot "Overlays/AORs on images..." option by changing the tentative epoch of observation. This way the array can be rotated to the desired angle by the time dependent array position angle. |
Unchopped grating scan off-position |
The off-position can be specified by relative offset in arcminutes with respect the target coordinate, or alternatively, you can define an absolute position within a two degrees radius. In case you prefer to use the absolute position option then it is highly recommended to specify RA/Dec via the standard HSpot target definition window. You can have access to this window by clicking on the "Choose Position" button. This panel is enabled only for the unchopped grating scan mode. |
