3.8. Spectral leakage regions

The precision of the relative spectral response is affected by spectral leakage (order overlap due to finite steepness of order sorting filter cut-off edges) from grating order n+1 into grating order n. At wavelengths of 70–73μm, 98– 105μm and 190–220μm the next higher grating order wave- lengths of 52.5–54.5 µm, 65–70 µm and 95–110 µm do overlap respectively (leakage regions on measured spectra are shown in Figure 3.16, Figure 3.17 and Figure 3.18). Continuum shapes and flux densities in these border ranges are therefore less reliable than in band centres. Band B2A is not affected by spectral leakage.
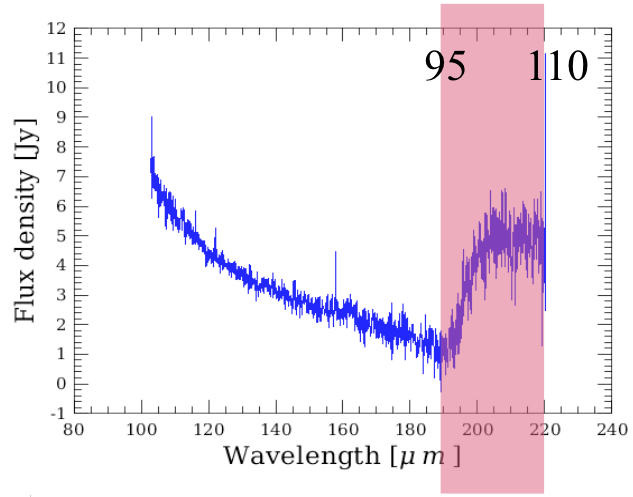
Spectral leakage in band R1: the spectrum between 190-220 µm has an unreliable (line) flux calibration, and shows superimposed spectral features from order 2 (95-110 µm).
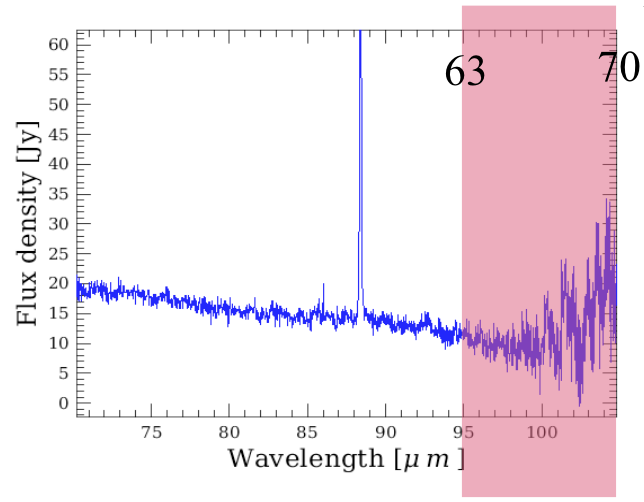
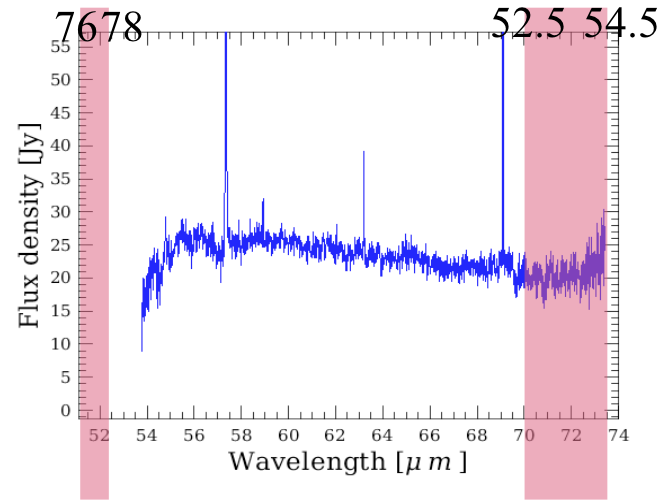
Figure 3.16. Spectral leakage in band R1: the spectrum between 190-220 µm has an unreliable (line) flux calibration, and shows superimposed spectral features from order 2 (95-110 µm).

Spectral Spectral leakage in band B2B: beyond 98 µm the response is very low, and spectral features from order 3 (63-70 µm) are superimposed on the spectrum.

Figure 3.17. Spectral Spectral leakage in band B2B: beyond 98 µm the response is very low, and spectral features from order 3 (63-70 µm) are superimposed on the spectrum.

Spectral leakage in band B3A: beyond 70 µm, the order 4 (52,5-54.5 µm) spectrum is added to the 70-73 µm order 3 spectrum. The 51-52 µm order 3 spectrum also shows the 76-78 µm order 2 spectrum.

Figure 3.18. Spectral leakage in band B3A: beyond 70 µm, the order 4 (52,5-54.5 µm) spectrum is added to the 70-73 µm order 3 spectrum. The 51-52 µm order 3 spectrum also shows the 76-78 µm order 2 spectrum.