The areas of the sky accessible to the Herschel telescope were determined by a number of constraints applicable to Sun, Earth, Moon and other bright solar system objects. In particular, the following constraints were applicable through the mission:
Sun-S/C-LoS angle in the S/C XZ plane (Solar Aspect Angle or SAA) of 60°.8 to 110° for normal operations. The allowed range was reduced with respect to the original one (60° to 120°) as, post launch, a small change was made to the extreme range of permitted of solar aspect angles to limit it to a maximum range from 60°.8 to 119°.2.
.Similarly, since in the extreme SAA range ('warm' attitude range, SAA in the 110° to 119°.2 interval), a noticeable pointing performance degradation (larger APE and pointing offset drift) due to thermo-elastic effects was observed. Moreover, this degradation persisted even when the S/C was brought back to 'cold' attitude until the structure settled back in the original position. As the telescope pointing performance improved it was noticed that the degradation was present at even smaller SAAs from 105-110°, leading to a further restriction in the freely scheduled "cold" area of the sky.
Nevertheless, if deemed unavoidable, short (normally less than 1 hour) observations in the 'warm' SAA range (105° to 119°.2) could be scheduled, normally at the end of operational days. The observer needed to be aware that in such cases, a degradation of the pointing accuracy was very likely, particularly beyond 110°. Longer observations would only be scheduled if scientifically strongly justified and taking care to minimise the impact on observations from other programmes. On some occasions it was necessary to hold Herschel at hot attitudes for as long as two days for instrument recovery activities: in such cases only observations robust against pointing drift would be scheduled until cold conditions had been restored.
Similarly,
Maximum roll angle of ±1°
In addition, the following extreme Earth and Moon angles occurred across the mission (to be taken into account for straylight considerations):
Sun-S/C-Earth angle of 37°
Sun-S/C-Moon angle of 47°
In order to avoid straylight pollution and also for safety reasons (to prevent large fluxes of light from reaching detectors), the nominal half-cone exclusion angles listed in Table 2.3 applied to observations towards major planets.
Table 2.3. Nominal exclusion angles (half-cones) for observation towards major planets
| Instrument | Mode | Mars | Jupiter | Saturn | Instrument |
|---|---|---|---|---|---|
| Critical | |||||
| a. SPIRE determined that, while Jupiter and possibly Saturn would not damage the instrument, they would have rendered it inoperable for a significant period (possibly even an entire OD) | |||||
| b. For SPIRE PACS parallel mode both the SPIRE and PACS restrictions applied. | |||||
| c. HIFI wished to avoid straylight pollution when observing fainter objects with a SSO close to the instrument LoS. The instrument would not be harmed by the presence of a major SSO in the FoV and did, in fact, even use Mars as its primary calibrator. | |||||
| d. During slews, the detectors were ON (photometry, spectroscopy or parallel mode). | |||||
| e. During non-SSO PACS observations. PACS also observed these SSOs directly. | |||||
| SPIRE | Slew | 15 arcmin | 15 arcmin | 15 arcmin | Yesa |
| Pointing | 1.5 deg | 1.5 deg | 1.5 deg | Yesa | |
| HIFI | Slew | 36 arcmin | 36 arcmin | 36 arcmin | Noc |
| Pointing | 36 arcmin | 36 arcmin | 36 arcmin | No | |
| PACS | Slewd | 4 arcmin | 4 arcmin | 4 arcmin | No |
| Pointinge | 1.5 deg | 1.5 deg | 1.5 deg | No | |
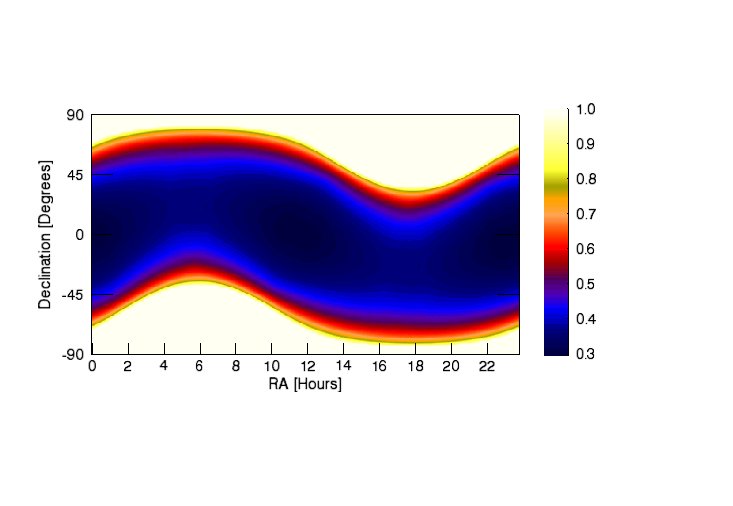
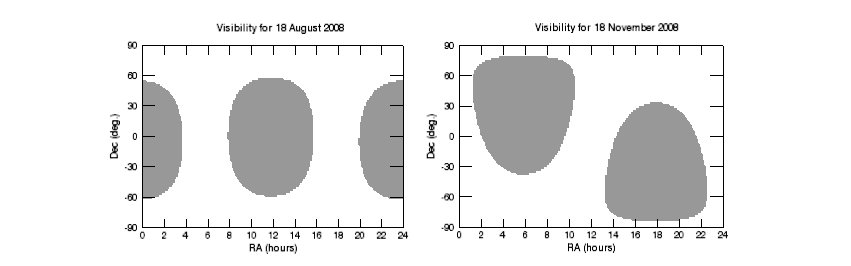
Figure 2.9. Top: The sky visibility across the sky as a fraction of the total hours through the Herschel mission, represented as a colour scale (shown at right) where black represents 30% visibility and white represents permanent sky visibility. Bottom: sky visibility for two sample dates. Shadowed areas represent inaccessible sky areas.
The time windows when a fixed or moving target or list of targets were visible can be calculated with HSpot. The tool provides an easy way to check in which time intervals a source was visible during the mission. The visibility calculation does not take into account the avoidance cones around Jupiter, Saturn and Mars described above.
The sky visibility for each date has been determined by the launch date (14th May, 2009) and the orbit of the satellite. Considering the nominal duration of the operations, all areas in the sky were visible at least 30% of the time. The sky visibility region moved slowly on a daily basis. The two snapshots at the bottom of Figure 2.9 illustrate the typical sky visibility differences after a 3 month interval; although this was calculated for an different launch date to the actual one, the graphic remains a valid representation of the effect.