Visualising a small map of Comet 2P/Encke:
Enter "Encke" (NAIF ID = 1000025) as a moving single target using the HSpot Target entry window (the bull's-eye icon).
From the Images menu, select "ISSA image". Make sure that Encke is the target in the ISSA image dialogue window. Accept the defaults (e.g., 5-degree image size) and press OK. Enter 2008 June 05 00:00:00 as your selected date; this is not the default, but the midpoint of the first visibility window of the planned mission. You can select this by clicking on the date range for that window.
Resize the HSpot window to fill the screen and use the magnifying glass with the red "plus sign" (upper left) to zoom the image.
Go to the Encke icons on the right and bring up the ephemeris window by clicking on the list icon . Click "Show All Dates". The time taken by Comet 2P/Encke to cross the image depends on how close it is to perihelion and its apparent velocity in the sky.
Select the Distance Tool from the Overlays menu. Using the left mouse button, click at one date on the trajectory, e.g., 2008 April 01, and drag approximately to the next shown date to the left, 2008 April 10. Click on the Encke check mark to toggle off the trajectory and dates, so that you can read the distance off the display. The distance value can also be read by clicking on the Distance overlay table icon.
Click the Encke trajectory back on and the distances line off. Go into the Encke list icon and "Hide all dates," or select just a few for display.
To display your AOR, first select a date in the "visibility windows" pop-up.Then, in the "Observation" pull-down, select and instrument and observing mode. In this case "PACS Photometer" has been selected. Select the observing mode in the pop-up window and define any parameters that you wish to define (source flux estimates, repetition factor, etc.). In this case a raster map with 10 points, 10 lines and a separation of 10 arcseconds has been selected, with a repetition factor of 2 (i.e. the raster pattern will be carried out twice). Click on "Observation Est..." and check that the observation takes an acceptable amount of time. If satisfied and the time estimator accepts the observation, click OK at the bottom of the AOR window.
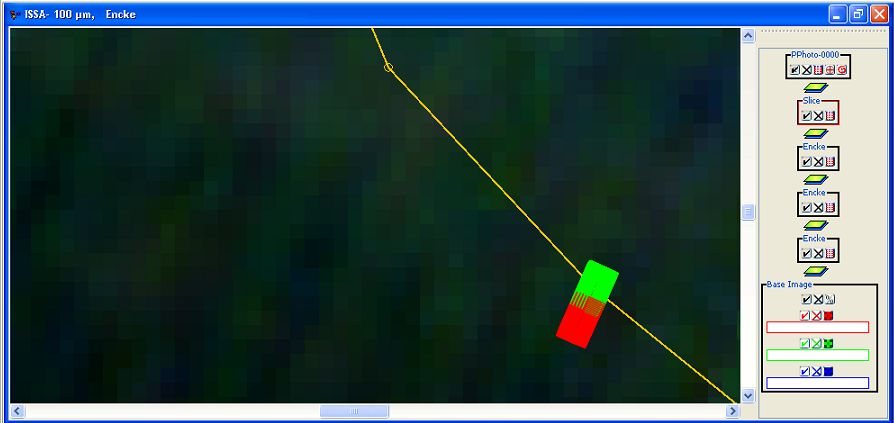
In the "Overlays" menu, select "AORs on Current Image". Answer "Yes" to having plotted the moving target provided that your target is on the displayed frame for the selected date. HSpot will now display the aperture positions on the sky for this observation (see Figure 20.10, “PACS Map”).
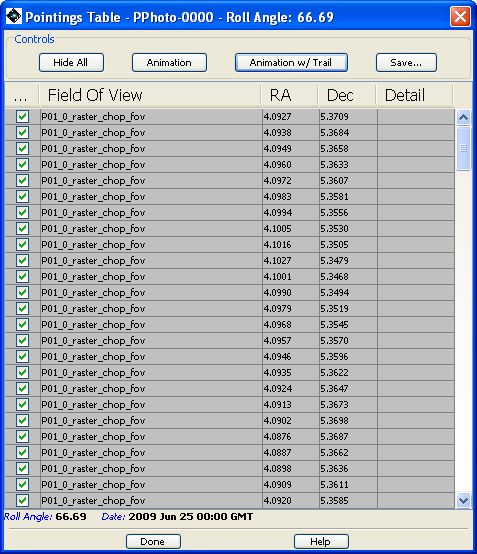
Click on the AOR display layer control pointings icon in the right hand sidebar (Figure 20.11, “PACS Map”). Select "Animation" or "Animation w/Trail". Clicking on "Animation" shows how the PACS field moves during the map. If you click on "Animation w/Trail" each successive position is displayed on the previous ones. Note that the mapping path that SPIRE/PACS may generally take is a zigzag shape on the sky, as compared to the shape that would be expected for a fixed target. This is because the spacecraft tracking of the rapidly moving Encke is being superimposed on the mapping motions of the AOR map. The Herschel pipeline has the capability to take these frames and recreate the map of the target in the target's rest frame. This will be a rectilinear map with the tracked extended target reassembled as a continuous image, but with the disjointed pieces of sky background that you may see.

Figure 20.10. The PACS raster map discussed above is shown. Note that the map may show a slight zigzag shape, due to movement of the target during the observation.

Figure 20.11. The control panel for the PACS raster map AOR that has been defined. The position of each integration is shown, along with date and roll angle information. Clicking on "Animation" shows how the PACS field moves during the map. If you click on "Animation w/Trail" each successive position is displayed on the previous ones.