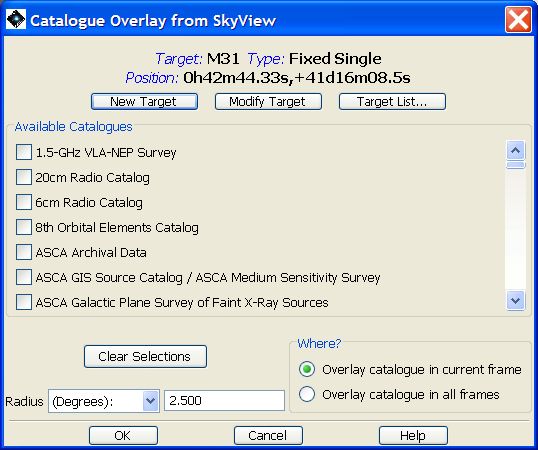
HSpot currently serves seven catalogues from IPAC servers whose sources can be overlaid onto the image display. From the dialogue (Figure 6.19, “HSpot currently serves seven IPAC catalogues that can be overlaid onto the image display”) you select the catalogue and appropriate search radius for sources. These catalogues are served from IRSA, like the ISSA and 2MASS images, and NED. The text catalogues are cached, like the images, to your designated cache directory (see Section 6.9.5, “ Cache Prefs ”).
Once the catalogue(s) is/are selected a search is performed and the catalogue object positions overlaid on the current image of the target. An example is shown in Figure 6.20, “The 2MASS extended source (crosses) and MSX (circles) catalogues overlaid on the IRAS - ISSA 25 micron image of M31. Bear in mind that the density of sources in some catalogues is very high and that they may thus be unsuitable for overlaying on a wide-field image.” where the 2MASS and MSX catalogues are overlaid on an ISSA 25 micron image of M31. Remember that your image will usually be square while the overlay will be calculated for a particular radius, so the search radius must be at least as large as the semidiagonal distance across the image.
The list of catalogues, highlighting of targets and changing of symbols can be done for each catalogue by clicking on the appropriate listing button ( )
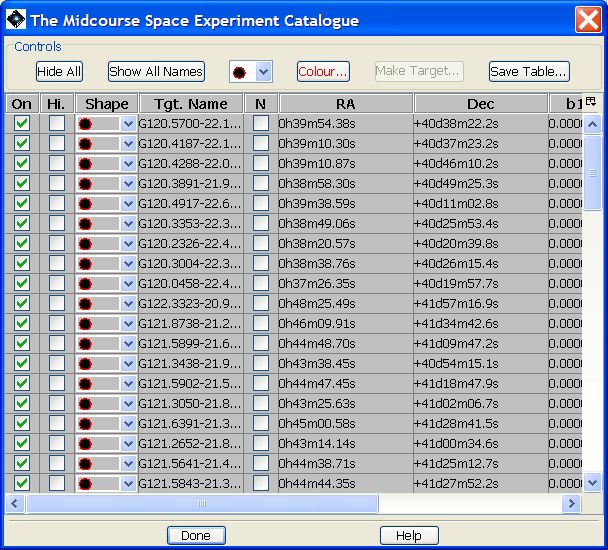
under the catalogue's name on the right hand side of Figure 6.20, “The 2MASS extended source (crosses) and MSX (circles) catalogues overlaid on the IRAS - ISSA 25 micron image of M31. Bear in mind that the density of sources in some catalogues is very high and that they may thus be unsuitable for overlaying on a wide-field image.”. This can be done for any overlaid catalogue and produces a listing similar to Figure 6.21, “Catalogue listing for the MSX points found in a search around M31”, which in this example is the MSX search results for the M31 area.
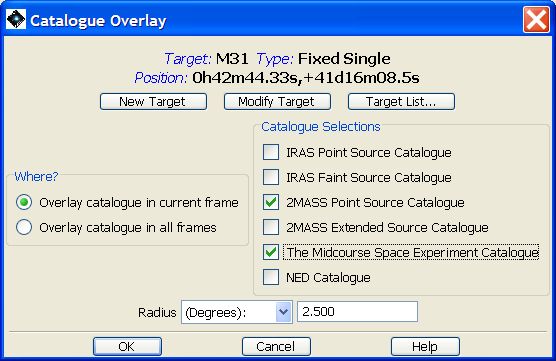
Figure 6.19. HSpot currently serves seven IPAC catalogues that can be overlaid onto the image display
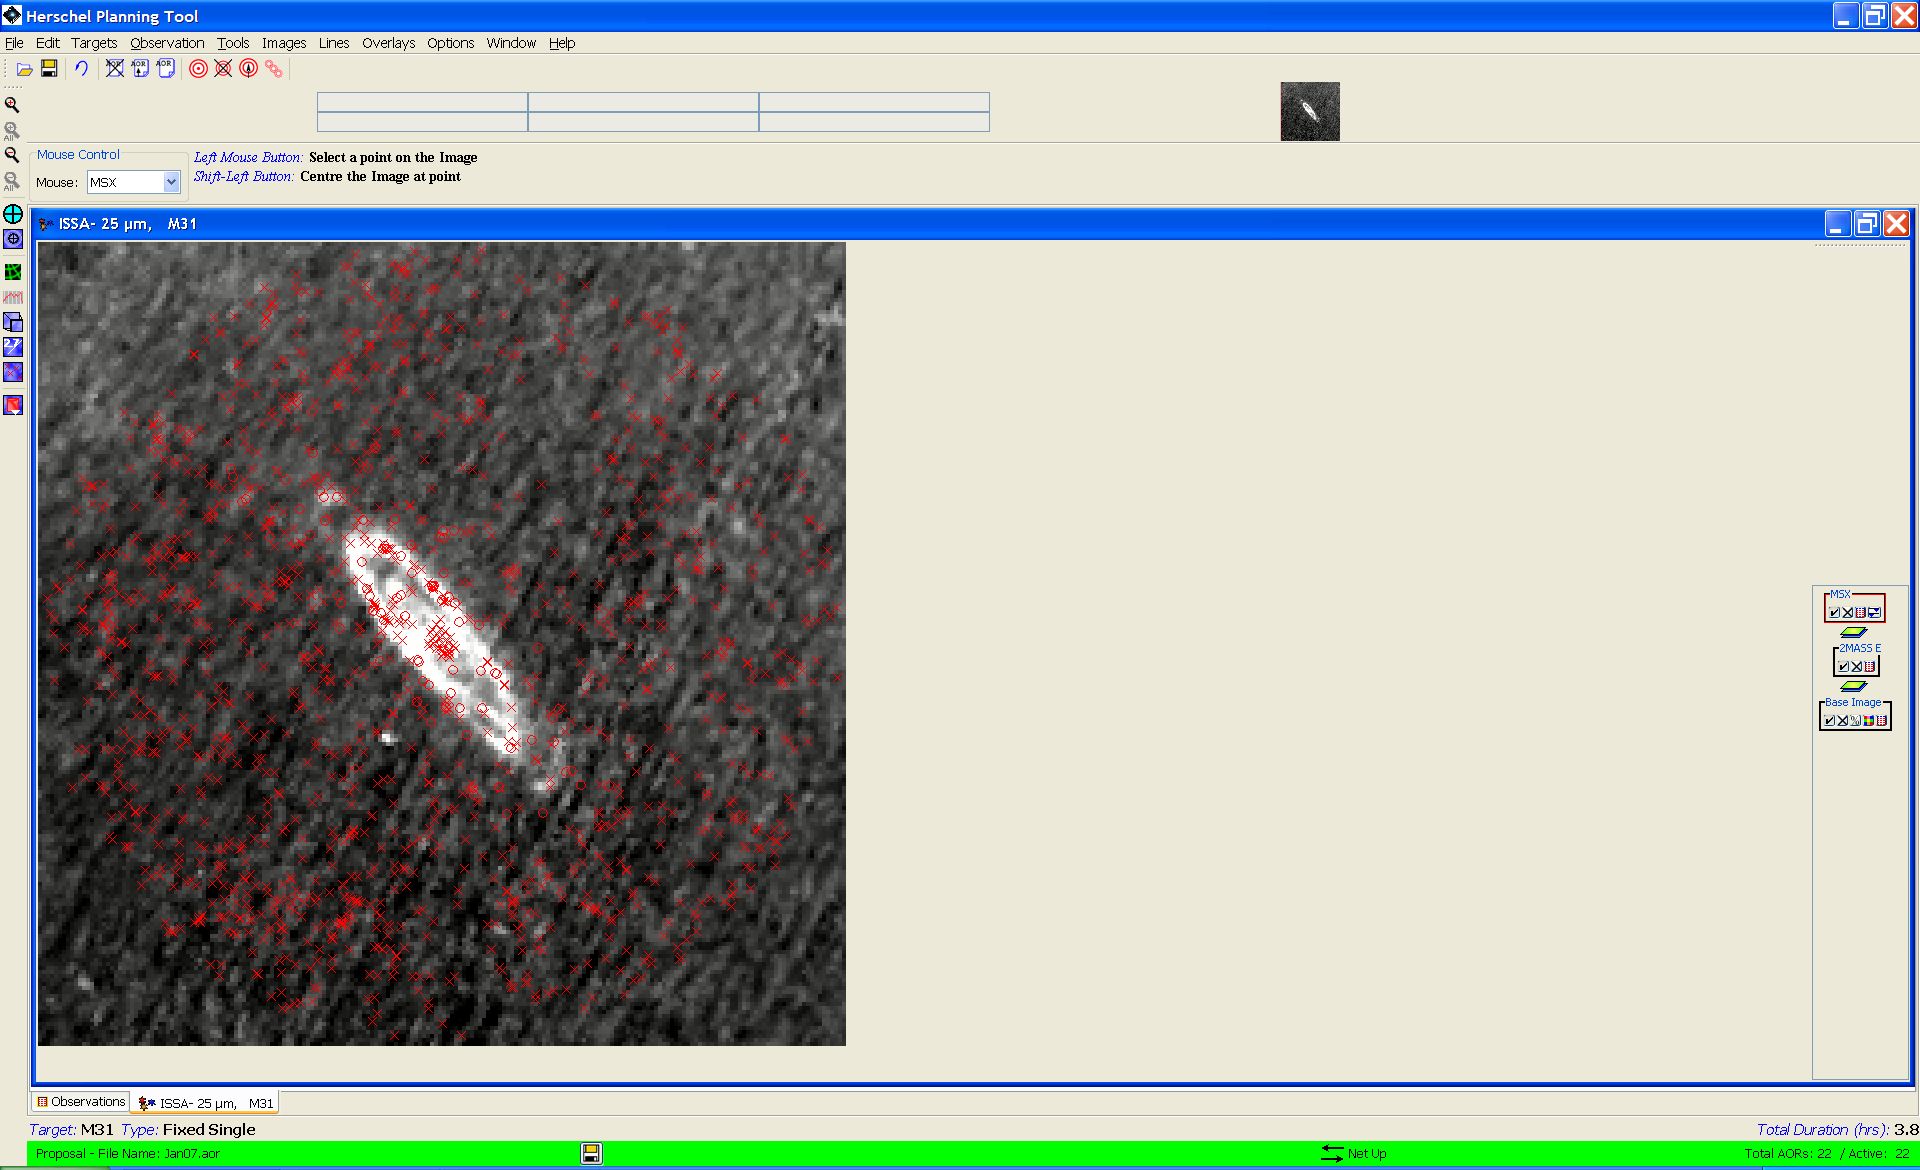
Figure 6.20. The 2MASS extended source (crosses) and MSX (circles) catalogues overlaid on the IRAS - ISSA 25 micron image of M31. Bear in mind that the density of sources in some catalogues is very high and that they may thus be unsuitable for overlaying on a wide-field image.
Each overlaid catalogue generates its own control panel to the right of the screen. Four buttons are generated:
You can switch the target overlay box in the control box to the right of the screen on and off by pressing the tick symbol. If you press the cross symbol you erase the overlay.
Tick mark: switches the overlay on and off. Useful for uncluttering without erasing the detections if you are overlaying from several catalogues on a single frame.
Cross: Erases the overlay completely. If you erase it you must redefine the overlay to regenerate it.
Page of text icon: Opens the catalogue file. This gives you the catalogue information for each detected source (name, position, flux(es), flags, etc.) and allows the presentation of the overlay to be modified. The control buttons allow the name of each source to be displayed on the overlay by selecting the "show all names" button (this action can be reversed by pressing this button again) and the shape and colour of the symbol to be changed; if you display several catalogues on the same image each is shown by default with the same symbol and colour, it is advisable to customise the symbols so that each catalogue's overlay can be identified.
It is also possible to change the display for one or a few sources identified in a single catalogue: to change the symbol used for the display, click on the drop-down menu in the "Shape" column for the source or sources that you wish to identify with a different symbol; selecting the "N" column for a source switches its name on and off in the image; selecting the "On" column hides and displays the source; while the "Hi." column changes the colour of the symbol to its inverse (e.g. red to blue).
Blue pennants icon: allows the overlay to be constrained. The data field can be selected and the constraint; a slide bar can be moved to show a range of fluxes, for example, only to display sources brighter or fainter than a certain flux.
HSpot currently serves a large number and range of catalogues from HEASARC whose sources can be overlaid onto the image display. From the dialogue (Figure 6.22, “HSpot currently serves catalogues from SkyView that can be overlaid onto the image display”) you select the catalogue and appropriate search radius for sources. The text catalogues are cached, like the images, to your designated cache directory (see Section 6.9.5, “ Cache Prefs ”).
HSpot can also overlay a catalogue file from local disk if it is in the modified IPAC table format. The selection dialogue is shown in Figure 6.23, “Local catalogue selection”. A description of the modified IPAC table format is provided below. The file should have the 'tbl' extension so that HSpot knows it is an IPAC table. The format is comprised of three parts: keywords, column headers, and data in columns.
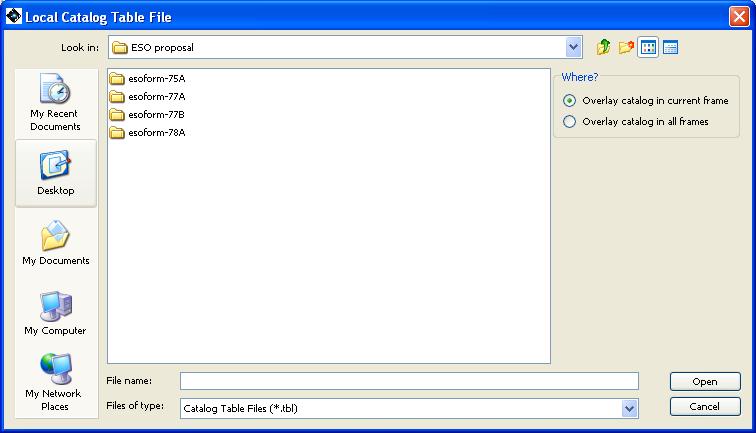
Figure 6.23. This dialogue will allow you to select a local catalogue file, in the modified IPAC table format, to overlay onto your images.
Keywords start with a back-slash (\). There should be no space between the back-slash and the keyword. For example:
\ORIGIN = 'IPAC Infrared Science Archive (IRSA), Caltech/JPL'
\fixlen = F
\RowsRetrieved = 215
The required keyword is \RowsRetrieved which tells how many lines of data are in the file. The keywords are placed first in the file and they must be followed by column header lines.
The column headers describe the name, data type, and units of the tabular data.
| name1 | name2 |
| data type | double |
| unit | degrees|
| null1 | null2 |
The three required columns are:
| name| ra| dec|
| char| double| double|
| | degrees| degrees|
| null| null| null|
All four column header lines are required. Every column owns the rightmost bar, except for the first that owns two bars.
Note that spacing is extremely important. All columns must fit within the space delimited by the vertical bars, as in the following example.
\RowsRetrieved = 10
| fscname  | ra     | dec    | fnu_12| fnu_25| fnu_60| fnu_100|
| char     | double | double | double| double| double| double |
|          | degrees| degrees| Jy    | Jy    | Jy    | Jy     |
| null     | null   | null   | null  | null  | null  | null   |
F23545+2632 359.2639 26.8250  0.221   0.112   0.126   1.100
F23548+2633 359.3554 26.8394  0.173   0.103   0.554   1.219
F23567+2659 359.8219 27.2697  1.298   0.315   0.152   0.838
F23568+2554 359.8425 26.1917  0.070   0.111   0.303   0.848
F23574+2800 359.9940 28.2814  0.112   0.054   0.228   0.951
F23561+2901 359.6731 29.3036  0.091   0.118   0.249   0.616
F23570+2846 359.8954 29.0547  0.224   0.130   0.146   0.465
F23554+2822 359.5090 28.6531  0.202   0.149   0.310   2.078
F23555+2735 359.5287 27.8722  0.098   0.170   0.234   0.840
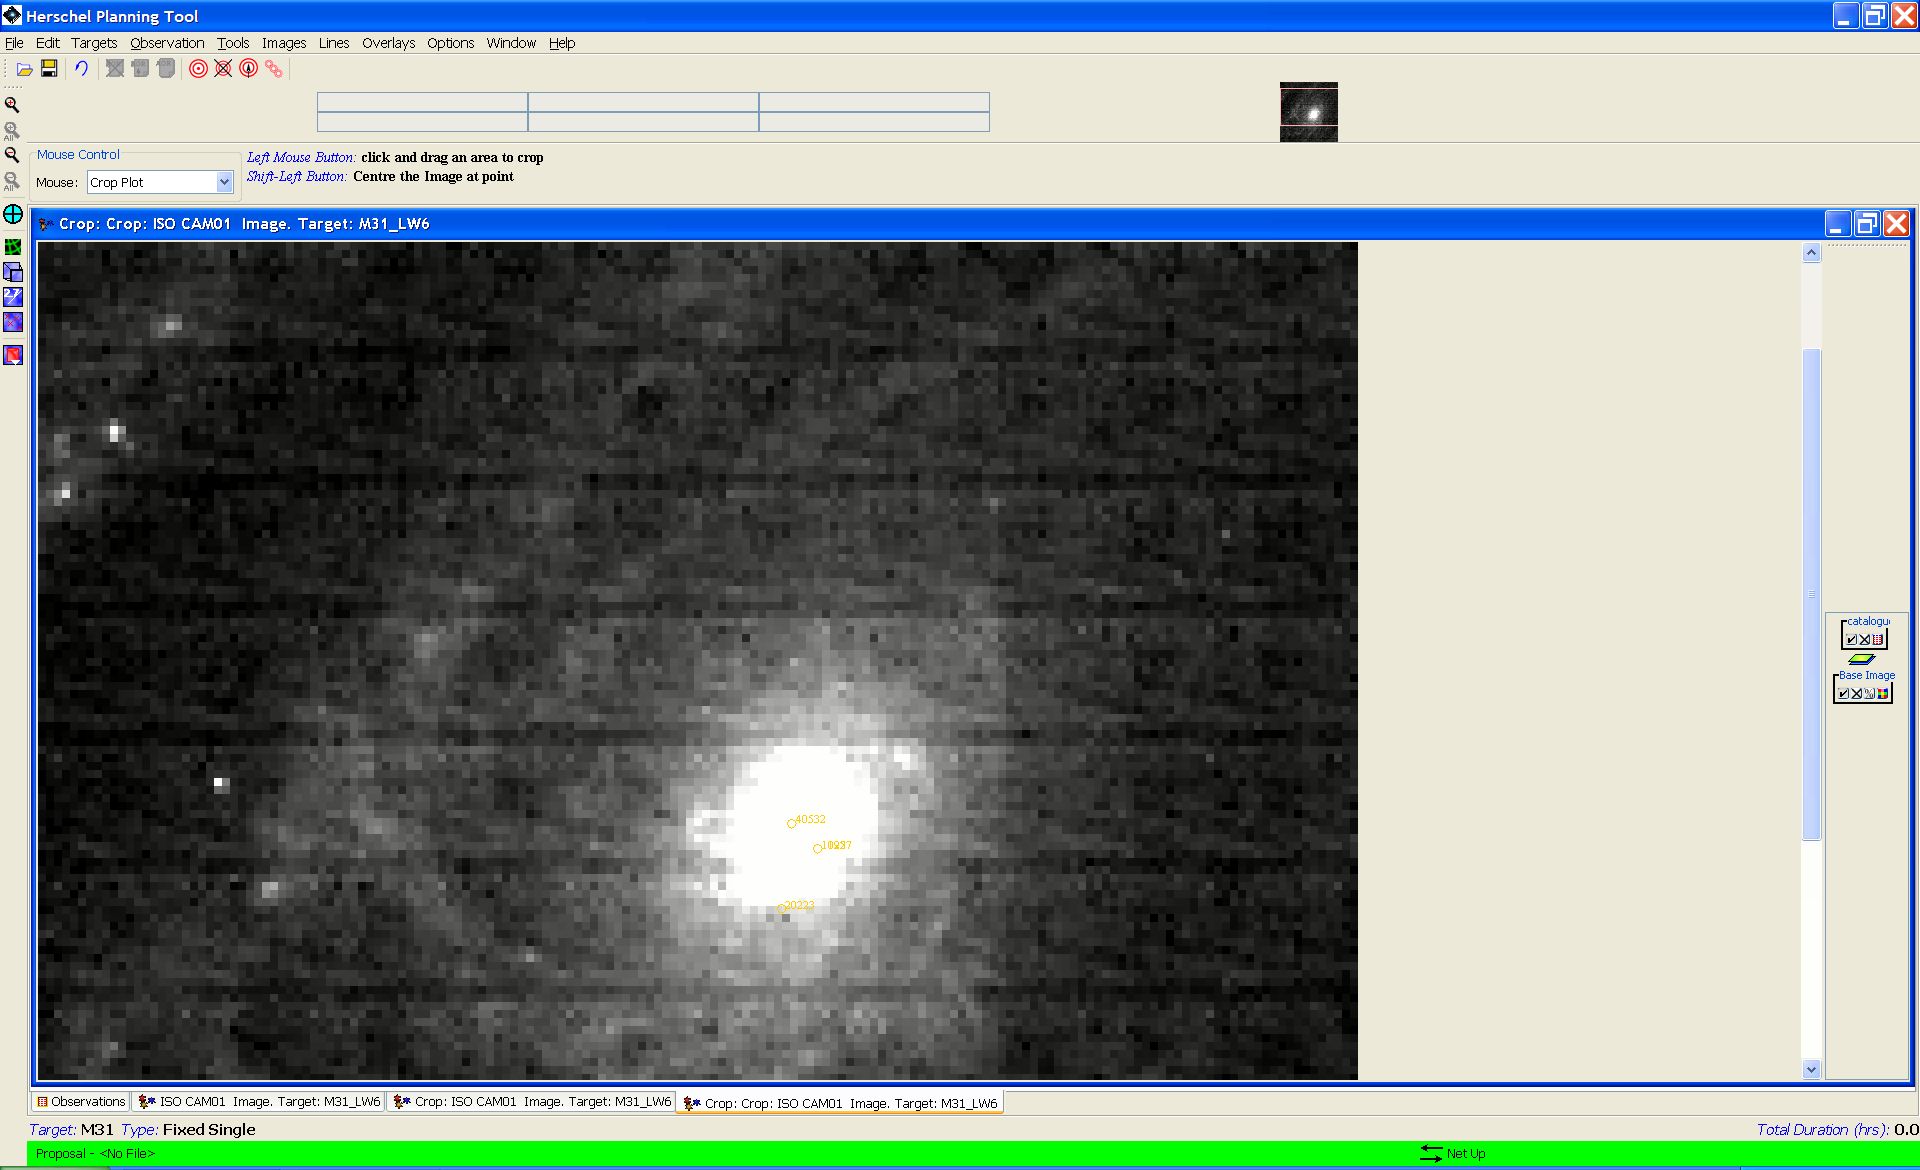
HSpot will allow you to crop an image to any required size. Press the left button of the mouse on the top left hand corner of the area that you wish to display and draw the box across. When you release the mouse button the image is automatically cropped to just the part in the box (Figure 6.24, “The crop image display. Instructions appear at the top of the screen, above the image.”). The cropped image will display as a new image layer. If the image is larger than the screen size, by pressing SHIFT + left button at any point in the image the image will be centred there.
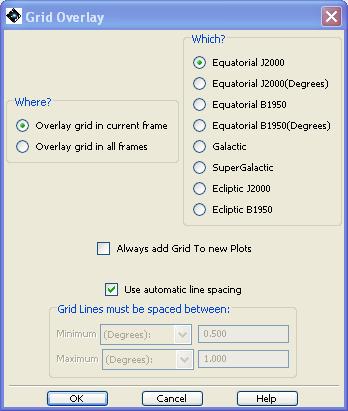
HSpot will overlay a variety of coordinate grids onto the image display. From the dialogue (Figure 6.25, “The coordinate grid overlay dialogue allows selection of the desired type of grid”), you select the type of grid and where to display it. You can now also force HSpot to overlay a coordinate grid on every image displayed, as well as control the spacing of the grid lines.
HSpot places a red box onto the current fixed target position in the displayed images. It also marks each offset position (in celestial coordinates) with a red plus sign if you have a cluster target type.
In the control box to the right of the screen you can switch the target overlay box on and off by pressing the tick symbol. If you press the cross symbol you erase the overlay.
This option allows you to visualise the track of moving targets. See Chapter 20 for a detailed description of how to use this feature.
This tool allows to you selectively mark and label points of interest on your image plot. An example is shown in Section 20.6.2. You can save the marks to a catalogue file (in IPAC table format) to local disk. This user-created catalogue later can be read back into HSpot to overlay (see Section 19.2.8.4).
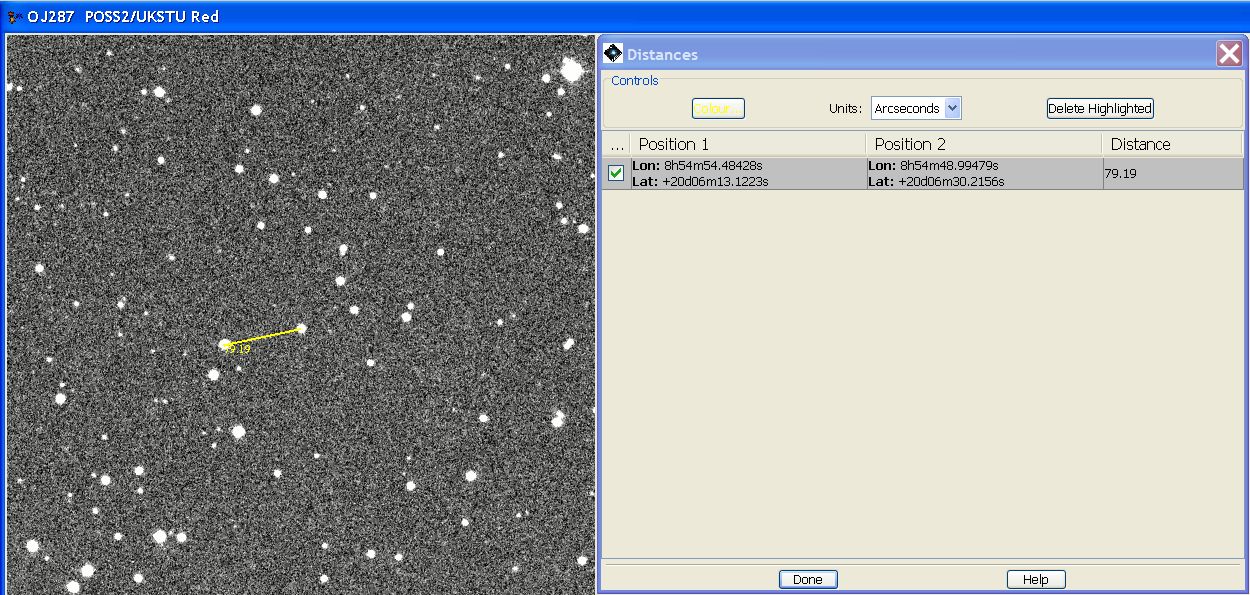
Once this item is selected, the left mouse button can be used to click and drag a line across a region on your image. The length of the dragged line in selected units is then displayed both on the plot and in tabular form. An example is shown in Figure 6.26).
To see the results, click on the table icon to the right of the image. It will open and give you the start and finish positions of the line and the distance between them. The default units are arcseconds, but the units can be changed to degrees or arcminutes using a drag-down menu. Clicking on a row in the table and pressing "delete highlighted" allows you to erase any line to reduce clutter in the image.
You can overlay an ISSA, 2MASS, MSX, DSS, SkyView, NED, ISO or a FITS file from disk onto your current image. Wavelength or generation (DSS) options are the same as for normal image display (Section 19.2).
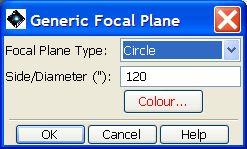
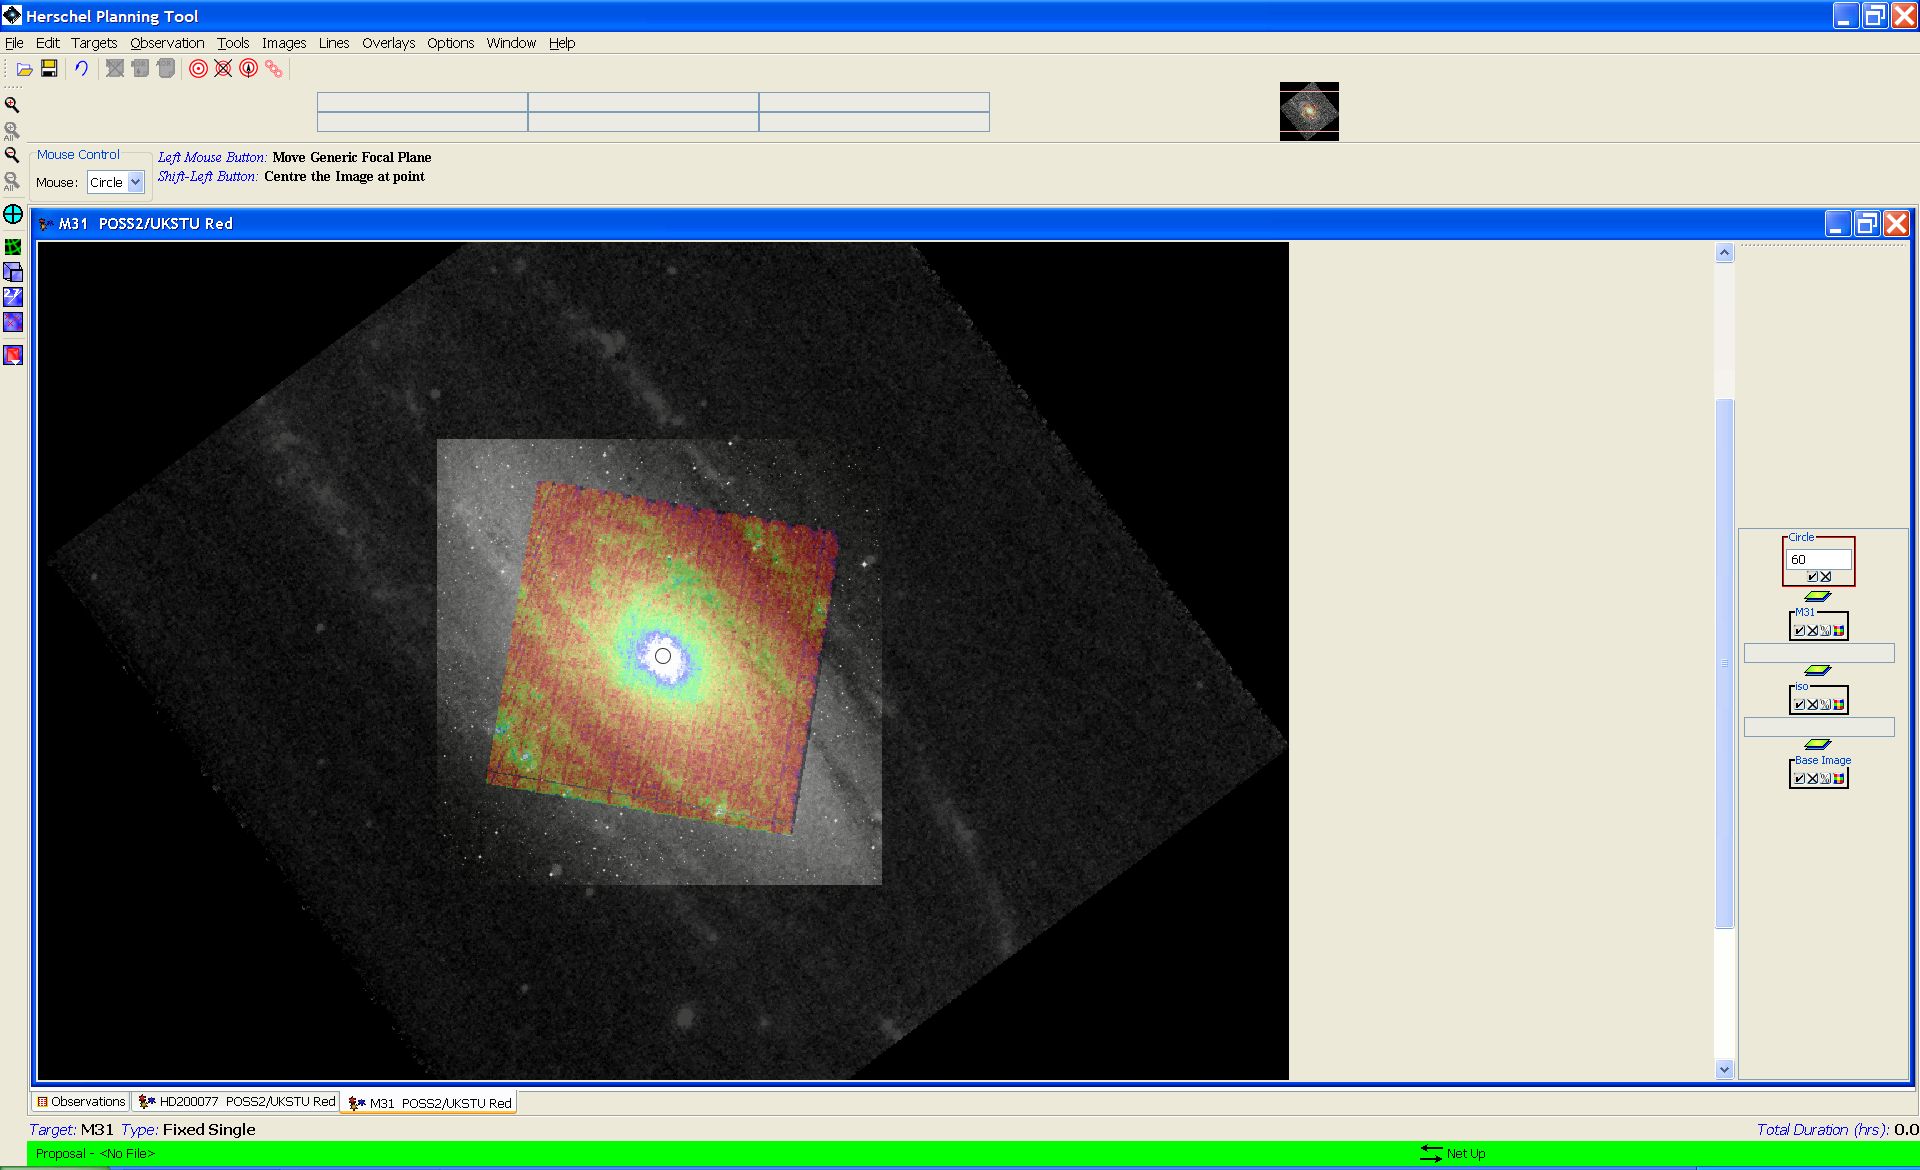
This tool allows you to overlay a user specified square or circular aperture onto your image. The dialogue is shown in Figure 6.27, “Generic focal plane selection”. However, to be able to edit the aperture using the control box - under the word "circle" in the red box in the right hand sidebar (Figure 6.28, “Generic focal plane display and control.”) - you must have first set a date of observation in the "Visibility Windows" dialogue. The aperture diameter should be entered in arcseconds and may take any value from 0 to 54 000 arcseconds.
This item allows you to overlay the Herschel Focal Plane at any position and specified
angle onto the current image (Section 20.6.6, “ Displaying the Herschel Focal Plane ”). When selected, the focal plane is drawn over the current image, centred on the current target position, and a box of controls is added to the side bar of the current image. This is the layer control, discussed in more detail in Section 20.6.6, “ Displaying the Herschel Focal Plane ”. The position angle (degrees east of north of the projected Herschel-to-sun vector) of the focal plane can be rotated by entering the value in degrees in the small entry field in the layer and hitting “Return”. To move the focal plane overlay to somewhere else in the image, click the mouse at the desired point in the current image. To change the colours of the instrument fields-of-view (FOV), where the focal plane is centred, and which instrument fields-of-view are shown, click the focal plane configuration icon in the "Herschel Layer" box on the sidebar ( ). This brings up the dialogue shown in Figure 6.30, “Focal Plane overlay control dialogue”. You can turn off/on any instrument fields-of-view or change their display colours here. To select which FOV in the focal plane is centred where you click the mouse, use the pull-down menu at the bottom of this dialogue. A display of the FOVs is given in Section 20.6.6, “ Displaying the Herschel Focal Plane ”.
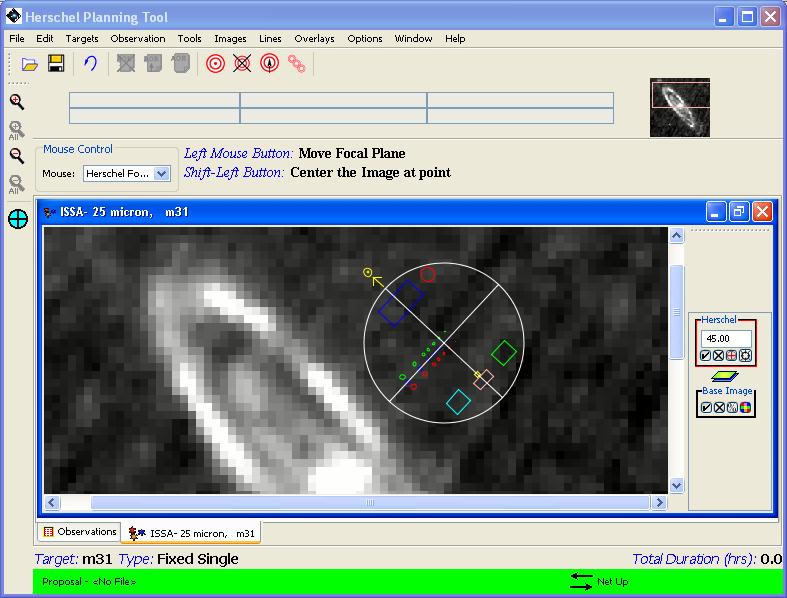
Figure 6.29. An overlay of the Herschel Focal Plane is shown on an ISSA 25 micron image. The desired position angle (e.g., 45), in degrees east of north, is entered into the field in the Focal Plane box.
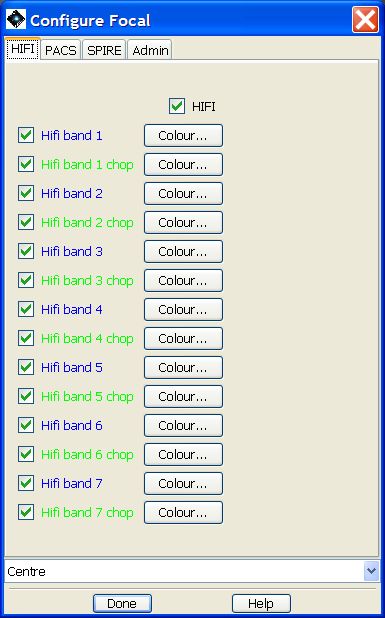
Figure 6.30. The configuration of the focal plane overlay is controlled from this dialogue. You can select the colours of the instrument fields-of-view overlays and also select which FOVs are shown. The pull-down menu at the bottom allows you to select which instrument FOV will be centred on the image where you click the mouse.
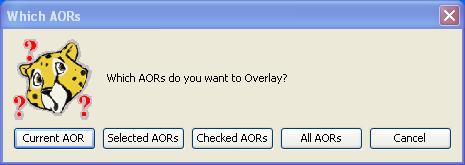
This function allows you to overlay the area coverage for one or more AORs onto the displayed images (see Section 19.2.8.3, “Overlaying an Image ”). When an AOR overlay is selected, the dialogue shown in Figure 6.31, “AOR overlay dialogue.” asks you which AORs to overlay: the current one, only selected AORs, only AORs checked in the "Observations" window, or all AORs currently loaded in HSpot.
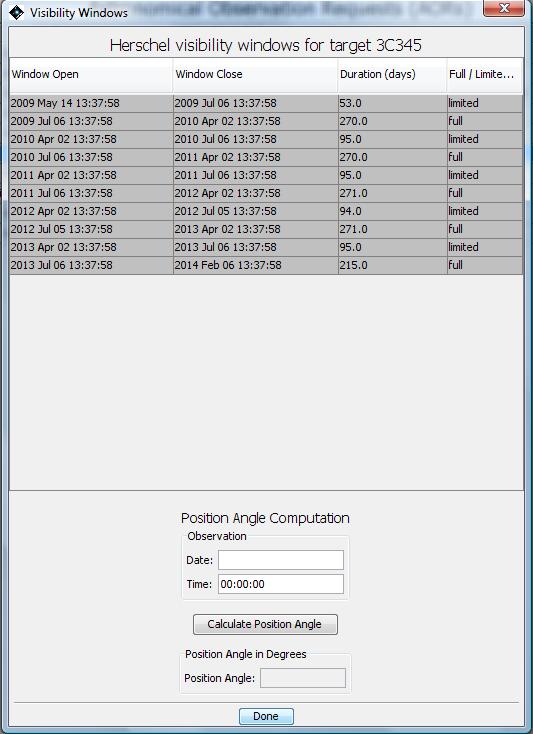
Next, the dialogue window for target visibility, shown in Figure 6.32, “Target visibility dialogue for a permanent visibility source.”, displays the visibility windows for the target, as well as a date in the middle of the next available visibility window, which is the default selection. If you want to plot the AOR for a specific observation date within any visibility window, enter that date here. You can click on any visibility window in the dialogue to automatically select the mid-date in that window. Or, just select the default. Click "OK" for the overlay. See the example in Section 19.2.8.4, “ Overlaying AORs ” for a description of how it works. HSpot must be connected to the Internet to do the overlay, as it contacts the HSC servers to get the correct orientation and sky positions for the overlay.
The set of pointings displayed can be viewed and saved. Click on the pointing list icon ( ) to the right side of the image. You can animate through the different pointings made by the telescope during the observations, with or without leaving a trail, and you can save the pointings in a ".pts" file which can later be overlaid on other images.
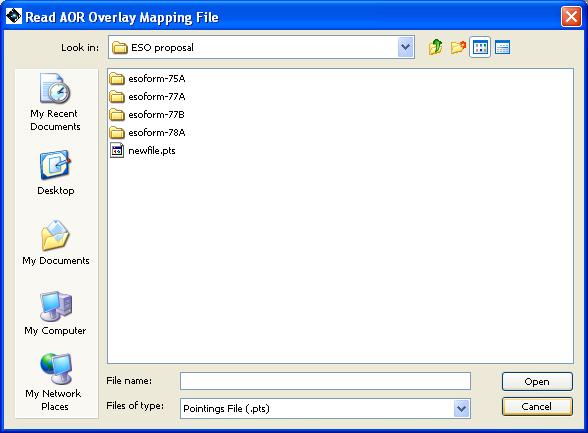
You can save the pointings table for an AOR overlay to local disk (see Section 6.8.1, “ Catalogue Overlay ”). This file can be read back into HSpot at a later time for overlaying on images. The dialogue for reading the file into HSpot is shown in Figure 6.33, “The dialogue for obtaining a previously saved set of pointings for overlaying on the current image. ”. Currently, only the overlay for one AOR at a time can be read in. This feature, however, is intended to make AOR overlays more convenient and to be a time-saver when planning your observations.
