To summarize the problem, since we have no sideband filter, whenever we take a spectrum with HIFI we get the sum of two spectra: one with the frequency axis ascending, one with the frequency axis descending. These spectra originate from the same general frequency regime, with their bandpass centres separated by about 12 GHz for Bands (1-5), and about 72 GHz for Bands 6 and 7 around the LO. For reference, at the top frequency of band VI (High), at 1900 GHz, 72 GHz is 1137 km/s.
Difficulties with overlapping sidebands will occur during line surveys. For example, the crowded line regions of Sgr B2 and Orion are very rich in line information, but the molecular emission and absorption lines will overlap and become blended. This is known from CSO observations ([17]) and others. Like HIFI, the CSO has no sideband filter. The capability to perform broad line surveys is one forte of HIFI, and there will most likely be Legacy Programs using HIFI concentrating on line surveys of rich molecular line regions. As to how many fainter regions will have rich or crowded line regions, it is known that certain type galactic objects have such spectra, but this issue needs more study.
The problem can and has been solved ([17]). Since one of the two IF passbands is reversed, there are multiple realizations of added spectra possible by shifting the LO in frequency a small amount within the intermediate frequency bandwidth (4GHz). In other words, different sky frequencies are added to different sky frequencies when the LO is shifted a bit, thus adding constraints to the problem by adding redundancy (see Figure 7.6, “Redundant LO settings.”).
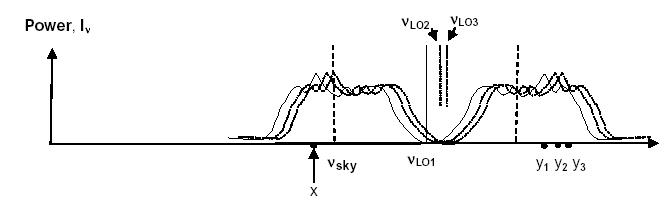
Figure 7.6, “Redundant LO settings.” above illustrates this. Here the two sidebands are overlaid on the sky frequencies. The LO has been placed at n(LO1), n(LO2), and n(LO3). By placing the LO in these positions, the point "x" in the lower sideband is added variously to y1, y2, and y2. Likewise with each shift of the LO, y1 is added to a different value in the lower side band, and likewise y2, and y3, making new paired sums. In this way, constraints as to the details of the underlying sky spectrum are added with each LO setting.
With added constraints, the problem becomes an inversion or minimization problem. Generally speaking, a sky spectrum is sought in both the upper and lower sidebands that can reproduce as closely as possible the double sideband observed spectra. Typically, this is done in a wide-band survey where the LO is stepped over a range such that a frequency will appear multiple times in the two sidebands. The optimal solution of the problem is the sky model that minimizes the error (the Chi-square) of the difference between the observed double sideband spectra and predicted double sideband observations based on the sky model. The more LO positions that are covered (with good S/N) the more strongly the problem is constrained.
It is important to point out that with each new LO setting there is a new bit of sky frequency that is covered and joins in the system of coupled linear equations (that is the sum of the upper and lower side bands added pair-wise). It is always the case that the highest frequencies covered by the upper sideband of the highest LO setting and the lowest frequencies covered by the lower sideband of the lowest LO setting will only be observed once and only once combined in a sum. Since there are unknowns at the extreme frequencies of the system, a unique solution cannot absolutely be reached and a small (insignificant) periodic ripple may be seen in solutions that otherwise satisfy the system of equations well.
Comito and Schilke ([17]) have implemented minimization methods, including the Maximum Entropy Method (MEM) and the Levenberg-Marquardt Method to solve the problem, including the case of crowded double sideband surveys of Orion observed with the CSO. These authors found that in the case of well-constrained DSB data (i.e., data with high S/N and many LO settings such that each frequency was combined with many others) an iterative Χ2 minimization was sufficient to solve the problem and yield reliable single sideband results.
The MEM approach has been found to be useful with less redundantly sampled data sets. In this approach, a maximum entropy term is maximized (such that the resulting solution has the least amount of structure possible) while, at the same time, the χ2 residual is minimized. A pre-selected balance between these two requirements is utilized. By only inserting as much structure into the solution as the data warrant, MEM produces good results on weakly constrained data sets.
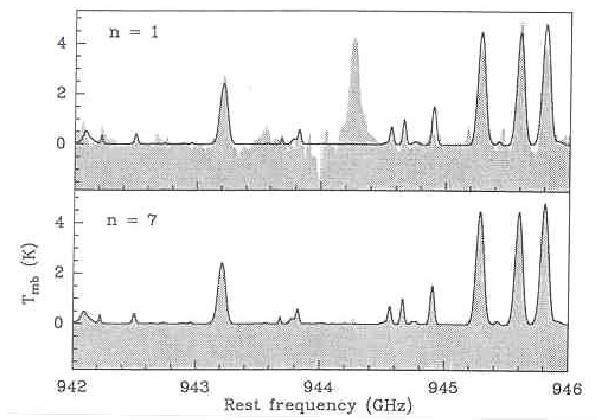
Figure 7.7. MEM deconvolution with a small (n=1) and large (n=7) degree of redundancy using a simulation with a known sky distribution.
In Figure 7.7, “MEM deconvolution examples”, the redundancy is defined as the number of independent LO settings minus one. The grey (MEM result) approaches the black line (correct sky spectrum) when the redundancy is high.
A user tool for general observers has been (and continues to be) developed for use within HIPE to extract scientifically optimal data from HIFI spectral scan observations (see observing Modes III-2 and III-3). Deconvolution is available as a task within HIPE and is found to work well with HIFI data although some data cleanup is generally needed, particularly when spurs occur in the data of spectral scans at particular LO settings.