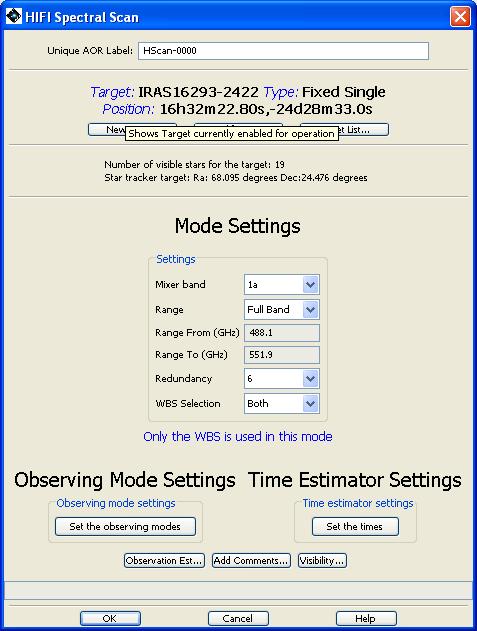
One of the most impressive capabilities of HIFI is its ability to cover a large range of frequency. A spectral scan mode of observing has been developed to take advantage of this. In this mode, the local oscillator frequency is stepped through a range of frequencies. A single request, providing a range of frequencies, is made by the user and the detailed settings are calculated by the software.
In this setup only the Wide Band Spectrometer data is guaranteed to be obtained. The HRS may run in a parallel serendipitous mode if the data rate limit is not exceeded.
This mode has been developed in association with a deconvolution algorithm (see Chapter 7, Pipeline and Data Products Description ) which is able to take the double sideband data that HIFI obtains and produce a single sideband spectrum (see Chapter 2, HIFI Instrument Description regarding single and double sideband data and HIFI).
There are three modes for doing spectral scans. A Dual Beam Switch (DBS), Frequency Switch or Load Chop referencing mode may be used. For small sources less than 3 arc minutes across the DBS mode can be used. Frequency switch and load chop modes can be used for sources inside extended emission. Load chop is preferred for complex line sources.
In the following example, a hot core is to be surveyed using the spectral scan mode. The step-by-step setup is illustrated.
In this example we use the spectral scan AOT that allows wide frequency coverage on a single target. In this case, our target is a hot core, IRAS16293-2422. Our spectral scan is to cover the frequency range 488 to 620 GHz. These frequencies are covered by mixer bands 1a and 1b of HIFI. In order to do this observation we will need to make two observing requests, one for band 1a and one for band 1b.
Frequency setups considered:
	  A: Complete band 1a coverage
	  B: Complete band 1b coverage
To setup up our observation do the following steps for the first AOR, the band 1a full coverage.
1. Run HSpot
2. Choose target: Targets Menu -> New Target
   2.1 Enter target name: IRAS16293-2422
   2.2 Resolve the name (using SIMBAD option and fixed target tab).
   	Alternately, you can input the coordinates directly.
   2.3 Once resolved, acknowledge source coordinate by clicking OK
3. Setup observations: Observation Menu -> HIFI spectral scan
   3.1 Setup A
       Instrument setting
       - mixer band scroll down menu: choose band 1a
       - Range: full band -- we need to cover all of band 1a
       - Redundancy: 6 -- this indicates how many LO frequency settings
         there will be within the 4GHz IF frequency range. So a setting of 6
	 indicates data taken every 750MHz. Higher redundancy produces higher
	 quality results but at the cost of more observing time.
       - Both WBS polarizations are on -- the default
       (see Figure 6.36, “Filled in AOT for the example spectral scan observation.”)

       Mode setting
       - We will use the Dual Beam Switch reference mode.
       - No fast chop, no continuum to be used.

       Time Estimator settings
       - Select estimate to be done with a time goal in the
         corresponding scroll menu -> e.g. here "Time"
       - Input the required time in the table below: e.g. 3000 sec. For a
         spectral scan, a single scan can take a lot of observing time. If the
	 input user time is less than than the minimum time
	 possible for the request, then the returned value
	 observation time estimate is the minimum for the input
	 spectral scan settings.

       Observation Estimates
       - Click on the "Observation Estimates" button
	 -> the "HIFI Observation Breakdown" pops up with the results
	 -> we end up here with approximately 7607 seconds for a time
	 estimate, and a noise of 10 mK.
       - Use the "Show sequence parameters" or "Show message" button
       to display more information.
       - If these results are alright then click on OK. If not, then change
       the instrument settings and/or the time estimator settings appropriately.

       Add Comments
       - the user may add comments to the AOR (e.g., "This AOR forms part of
       a survey of a hot core from 488 to 620 GHz"). To do this, click on
       the "Add Comments button" and fill in additional comments text.

       Visibility
       - if you are interested in knowing when the AOR created
         is visible to the observatory, click on the "Visibility" button
	 -> visibility windows are shown in another window

     -> Once all this is done, click OK on the "HIFI single point
     Observation" window: your AOR is ready and labeled and should appear
     in the "Observations" window of HSpot.
In order to complete our survey we will also need to do a full spectral scan of the whole of band 1b. The following shows how this can be done.
   3.2 Setup B
       Mode setting
       - mixer band scroll down menu: choose band 1b
       - Full Band
       - Redundancy: 6 (as above -- for consistency)
       - Both WBS (ditto)
       - No fast chop, no continuum

       Time Estimator settings
       - Select your estimate time in the corresponding scroll menu
	 -> e.g. here "Time"
       - Select the required time in the table below: e.g. 3000 sec.

       Observation Estimates
       - same as setup A

       Add Comments
       - same as setup A

       Visibility
       - same as setup A

     -> Once all this is done, click OK on the "HIFI Spectral
     Scan" window: your AOR is ready and labeled.
