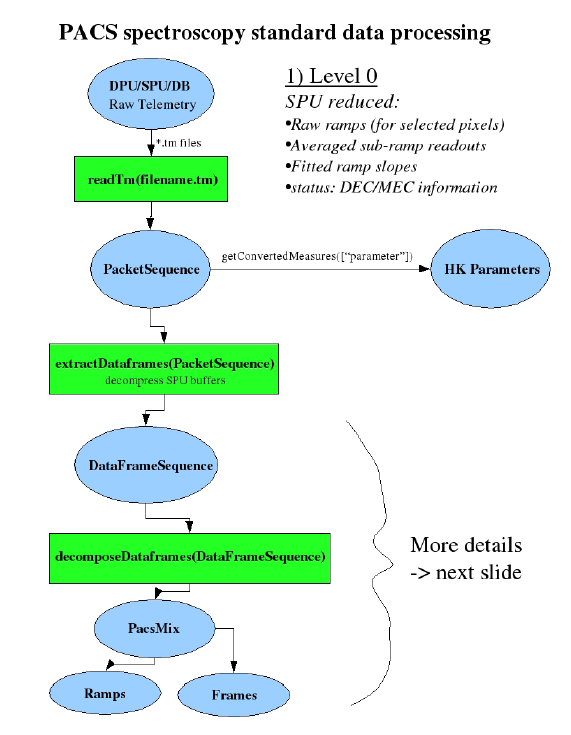
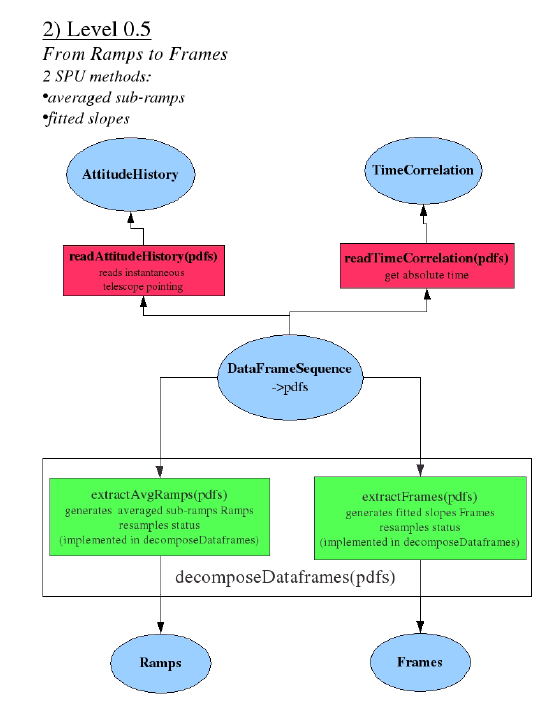
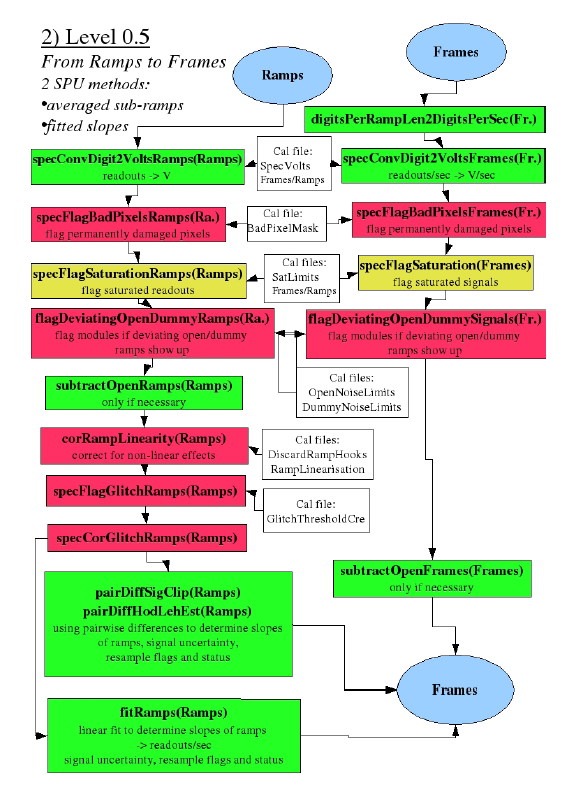
- Raw telemetry data is decompressed and stored as science (rotating raw ramps of 3 pixels and averaged ramps stored in Ramps objects) and housekeeping data
- Bad/saturated/glitched pixels are flagged and corrected if possible
- The corrected science data are reduced to signals [volt/sec] stored in Frames objects
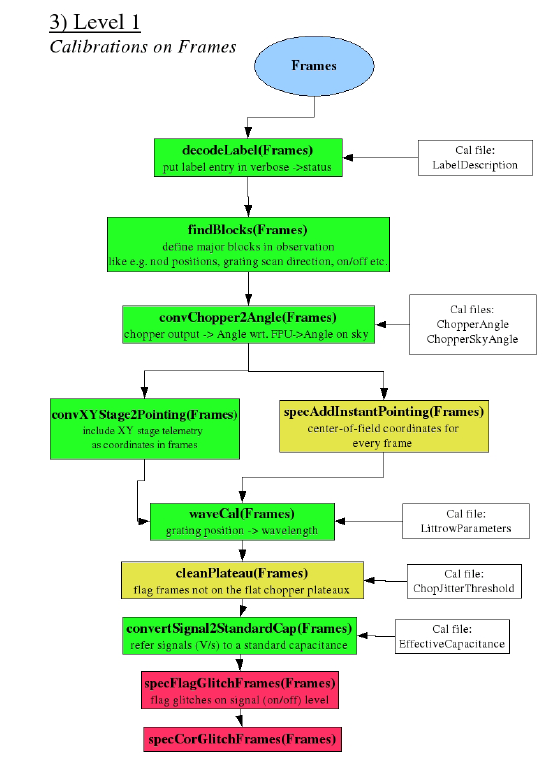
- Major observation blocks (like e.g. nod positions, grating scan directions) are summarized
- The chopper plateaux are cleaned from transition values and the chopper angle is converted to an the angle on the sky
- > Spacecraft pointing is associated to each signal frame
- Wavelength is calibrated and associated to each pixel
- Signal glitches are searched and corrected
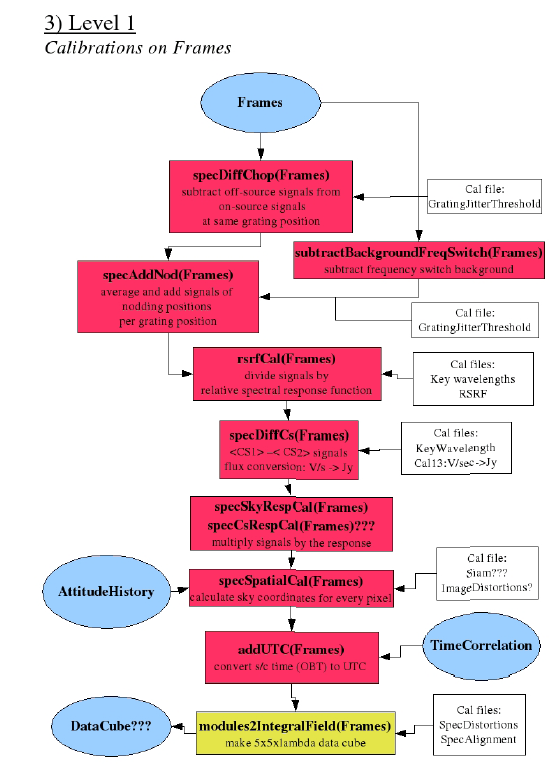
- The background is subtracted at the same grating positions
- Signals of nodding position are averaged at the same grating positions
- Signals are divided by the relative spectral response function
- The flux is calibrated using differential calibration source measurements to populate absolute response arrays [W/(V/s)].
- The signals are multiplied by the absolute response
- The sky coordinates are calculated for each pixel
- The s/c on-board time is converted to UTC
- Calibrated 5x5xlambda data cubes are generated
There is a Herschel-wide convention on processing levels of the different instruments.
Raw Telemetry : All telemetry packets produced by the instrument in the course of the observation. In PACS IA, we store/manipulate this level as a PacketSequence .
Level 0 data: Telemetry data as measured by the instrument, minimally manipulated and stored as Data Frames. For PACS spectroscopy, this level is stored/manipulated in a DataFrameSequence : a sequence of PACS dataframes, which are decompressed SPU buffers. What is contained in every decompressed SPU buffer depends on the SPU reduction mode. Typically there are several reduced readouts for every active detector (averaged ramp readouts or fitted slopes), 256Hz readouts for a few selected pixels and mechanism/status information sampled at 256Hz by the DecMec, the so-called DMC Header.
Level 0.5 data : The information contained in the Level 0 data is not sufficient to be able to process those data. The level 0.5 data is a bundle of Level 0 data and the data needed to fully process those data: auxiliary data for the timespan covered by the Level 0 data, such as the spacecraft pointing (attitude history), the time correlation, selected spacecraft housekeeping, etc... It is also possible to include in this bundle the level 0 data of 'associated' observations - e.g. flatfields or photometric checks taken throughput the operational day.
Level 1 data: Detector readouts calibrated and converted to physical units, in principle instrument and observatory independent. For PACS spectroscopy this is an oversampled 5x5xn cube with flux densities, associated wavelengths and sky coordinates for every flux density.
Level 2 data: Further processed level-1 data to such a level that scientific analysis can be performed. For optimal results many of the processing steps involved to generate level-2 data may require human interaction, based both on instrument understanding as well as understanding of the scientific aims of the observation. These data products are at a publishable quality level and should be suitable for VO access.
This level of PACS spectroscopy data consists of an image cube, the depth of the cube being the wavelength/frequency. Each layer in the image cube has the same sky projection. This cube is constructed by re-sampling the integral field cube (oversampled in wavelength, different projection per layer due to distortions) onto the same sky / wavelength grid of the instrumental resolution.
Level 2 data will can also contain a set of 1-dimensional spectra, Nyquist sampled to the instrument resolution, combining the data for one spatial pixel over different scans, applying noise filters, etc...
Level 3 data: These are the publishable science products where level-2 data products are used as input. These products are not only from the specific instrument, but are usually combined with theoretical models, other observations, laboratory data, catalogues, etc. Their formats should be VO compatible and these data products should be suitable for VO access.

